The Turkish Statistical Institute (TÜİK) reported on 10 November that industrial production, adjusted for seasonal and calendar effects, rose 2.1% in September 2026 after falling 0.9% in both July and August. The calendar adjusted index was 2.6% higher than a year earlier, against −1.7% in August (TÜİK, 2026a).1 August was first published as −1.9% on the year and −1.0% on the month (TÜİK, 2026b). Manufacturing rose 2.6% on the year and 2.3% on the month, mining and quarrying 1.2% and 1.1%, and electricity, gas and steam 4.0% and 0.1%.
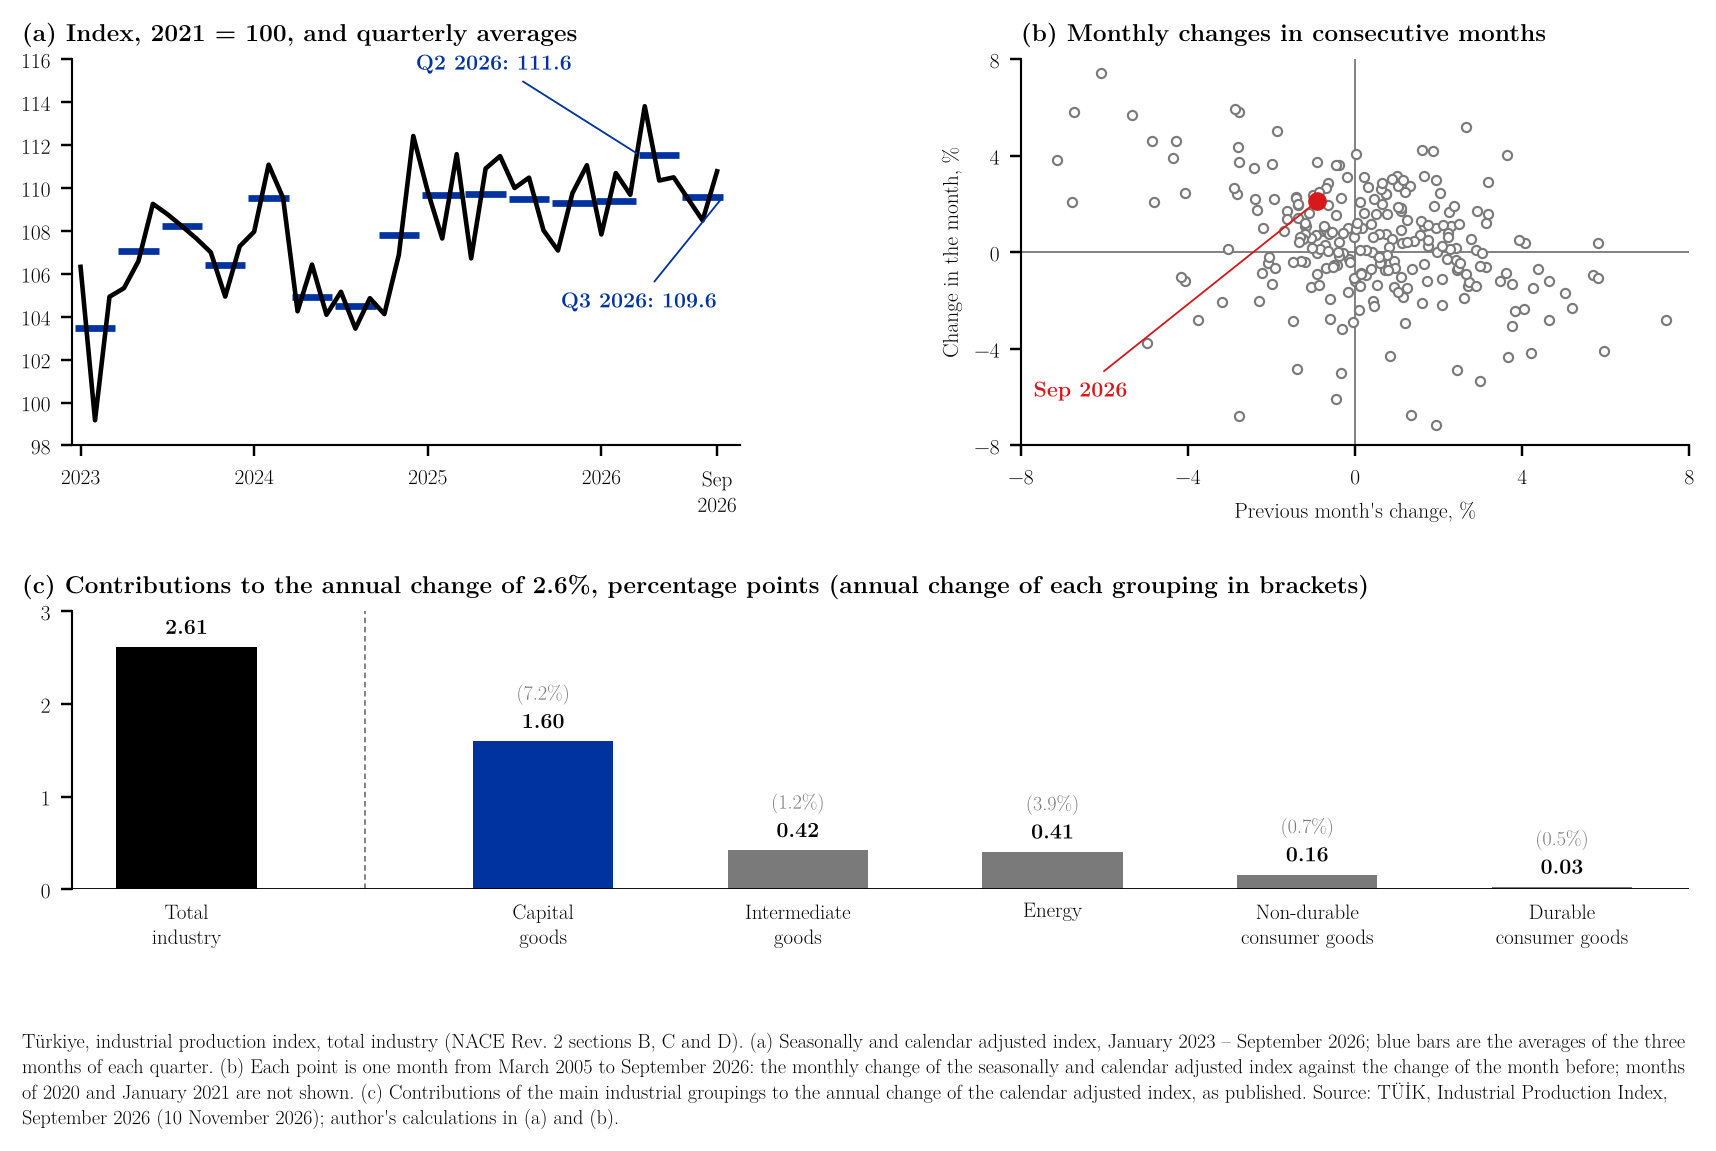
Capital goods account for 1.60 of the 2.61 points of annual growth, 61% of the total. Intermediate goods contributed 0.42 points, energy 0.41, non-durable consumer goods 0.16 and durable consumer goods 0.03 (Figure 1c). Capital goods output was 7.2% higher than a year earlier and 8.2% higher than in August, which is 1.82 of the 2.11 points of the monthly rise. Within manufacturing, the two largest contributions to its 2.59% annual change came from other transport equipment (34.8% on the year, 1.21 points) and computer, electronic and optical products (40.7%, 0.89 points). The two largest negative ones were fabricated metal products (−8.4%) and wearing apparel (−11.6%). High-technology manufacturing as a whole was 31.1% higher than a year earlier.
The quarter looks different from the month. The average of the seasonally and calendar adjusted index in July–September is 109.6, which is 1.8% below the second-quarter average of 111.6; the second quarter had been 2.0% above the first. On the calendar adjusted index, the third quarter is 0.2% above the third quarter of 2025, after 1.4% in the second (Figure 1a).2
Monthly changes of this index are large in both directions. Over the 260 months from February 2005 to September 2026 the median change is 0.4%, the interquartile range runs from −0.9% to 1.9%, and the standard deviation is 3.4 points, or 2.3 points without the months of 2020. A rise of 2.1% or more occurred in 58 of the 260 months (22%). Falls have more often than not been followed by a rise: production rose in 70 of the 108 months that followed a fall (65%), against 82 of the 151 months that followed a rise (54%). The correlation between the changes of consecutive months is −0.12, and −0.34 without 2020 (Figure 1b).3 These are descriptions of the published series; they are not a forecast of October.
The figures are subject to revision: the seasonal and calendar adjustment is re-estimated each month with the new observation, as the change in the August figures shows. The next release, for October, is due on 10 December.
References
Turkish Statistical Institute. (2026a, November 10). Sanayi üretim endeksi, Eylül 2026 (in Turkish; English title: Industrial production index, September 2026; No. 58189). https://veriportali.tuik.gov.tr/tr/press/58189
Turkish Statistical Institute. (2026b, October 9). Sanayi üretim endeksi, Ağustos 2026 (in Turkish; English title: Industrial production index, August 2026; No. 58196). https://veriportali.tuik.gov.tr/tr/press/58196
Notes
-
The monthly and annual changes of total industry and of the three sections are from the text of the bulletin (TÜİK, 2026a); the contributions and the changes of the groupings and divisions are from its table "Bölümlerin üst grup endeks değişimine etkisi, Eylül 2026". Annual changes are calculated by TÜİK from the calendar adjusted index and monthly changes from the seasonally and calendar adjusted index. The first-published August figures are from the headings of the previous bulletin (TÜİK, 2026b). The contributions of the divisions are contributions to the change of manufacturing, not of total industry. ↑
-
Data: the table "Sanayi üretim endeksi ve değişim oranları, 2005-2026" of the bulletin, total industry, calendar adjusted index and seasonally and calendar adjusted index, 2021 = 100, January 2005 – September 2026: index (CSV); the contributions table, all 42 rows: contributions (CSV). Both were read from the Excel files of the bulletin on 10 November 2026. The workbook lists every number in the note next to the formula that produces it and a check against the text, so that readers who wish to examine the calculations can follow and audit them in a spreadsheet without losing time and without running any code. The code that draws the figure and repeats the same calculations is available on request. ↑
-
Calculations (author's). With $S_t$ the seasonally and calendar adjusted index and $C_t$ the calendar adjusted index, the monthly change and the annual change, both of which reproduce the published rates: $$g_t = \left(\frac{S_t}{S_{t-1}} - 1\right)\times 100, \qquad \left(\frac{C_t}{C_{t-12}} - 1\right)\times 100$$ Quarterly averages are means of the three monthly indexes: $$\frac{109.490 + 108.489 + 110.781}{3} = 109.587, \qquad \frac{113.814 + 110.352 + 110.499}{3} = 111.555$$ Change between the two averages: $$\left(\frac{109.587}{111.555} - 1\right)\times 100 = -1.76$$ Share of capital goods: $$\frac{1.599}{2.614} = 61\%$$ Quartiles are computed as Excel's QUARTILE.INC does, and the standard deviation divides by $n - 1$. For the 259 pairs of consecutive months, the correlation is $$r = \frac{\sum (g_{t-1} - \bar g_{-1})(g_t - \bar g)}{\sqrt{\sum (g_{t-1} - \bar g_{-1})^2 \sum (g_t - \bar g)^2}}$$ "Without 2020" leaves out every pair in which either month is in 2020 (246 pairs remain). No monthly change in the sample is exactly zero. ↑