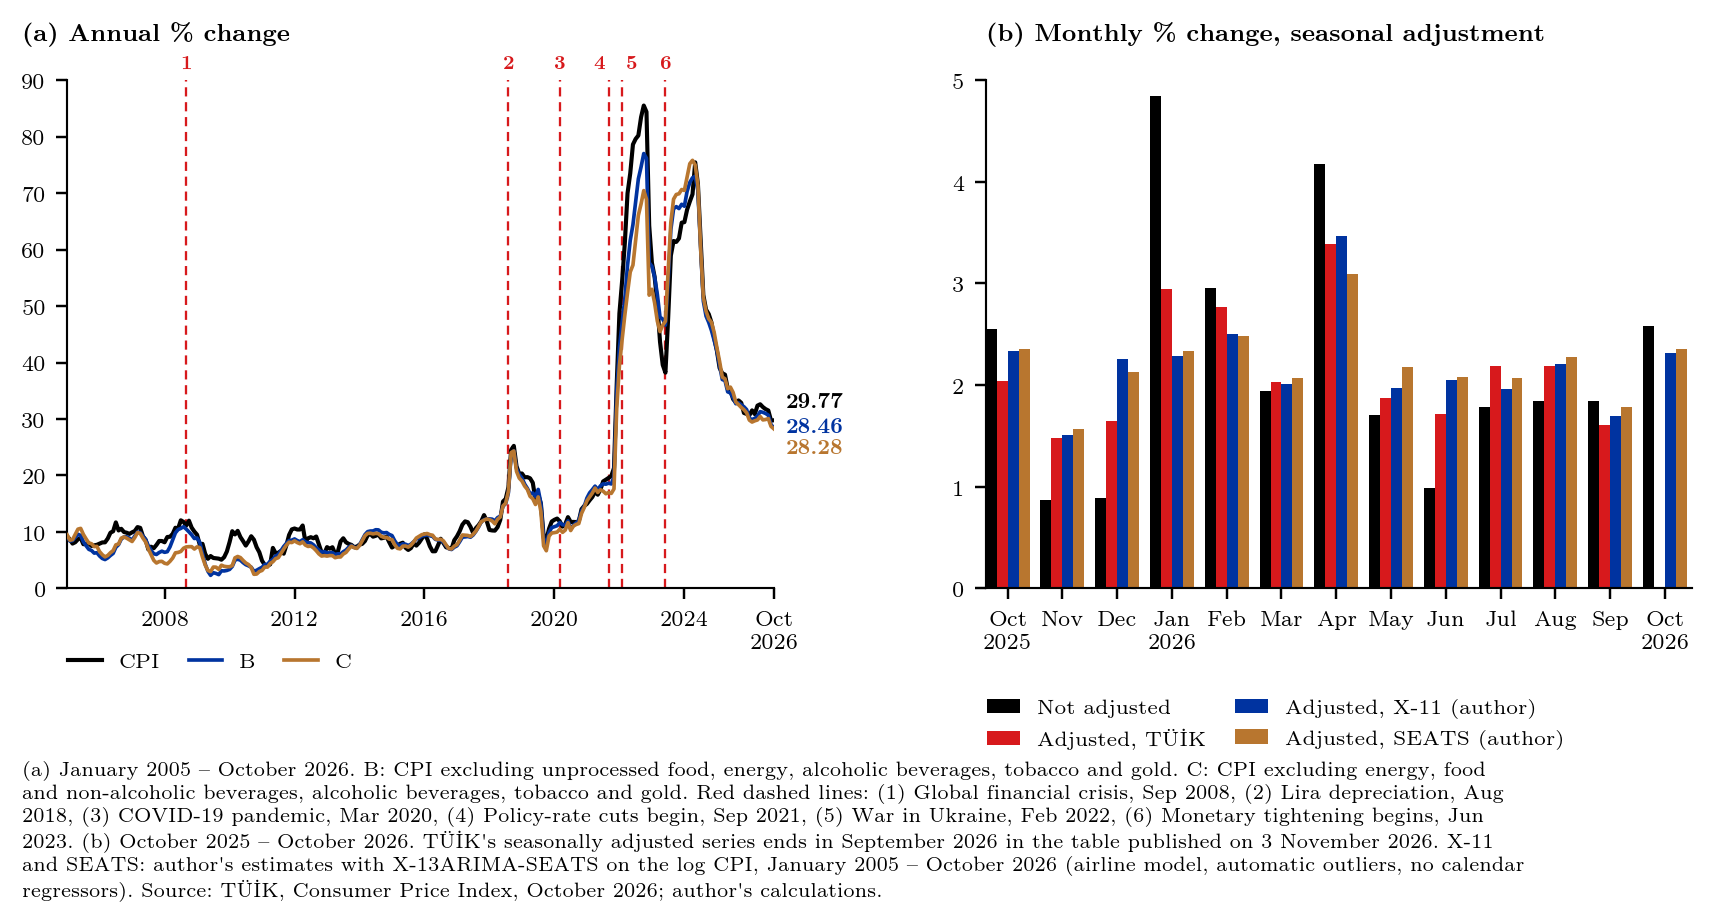
The Turkish Statistical Institute (TÜİK) reported on 3 November that consumer prices rose by 2.58% in October 2026 and by 29.77% on a year earlier (TÜİK, 2026a). Annual inflation was 32.87% in October 2025 and 48.58% in October 2024, and the average of the last twelve months was 31.23% above the average of the twelve before, against 37.15% a year ago. On TÜİK's figures, the annual, year-to-date (27.52% against 28.63%) and twelve-month-average rates are all lower than a year earlier. The monthly increase is the exception. At 2.58% it was slightly larger than the 2.55% of October 2025 that it replaced, so the annual rate edged up by 0.04 points from 29.73% in September.1 October's increase was also above the 2.11% that respondents to the October Survey of Market Participants of the Central Bank of the Republic of Türkiye (CBRT) expected for the month (CBRT, 2026b). Annual inflation has fallen by 55.74 points since its peak of 85.51% in October 2022.
Headline and core: the long view
Central banks watch core measures because the headline index is moved by large changes in relative prices, often caused by supply shocks, that need not persist, and a core measure tries to isolate the persistent part of inflation. Excluding food and energy is the traditional way of doing this, and Bryan and Cecchetti (1994) propose the weighted median of price changes as an alternative. TÜİK publishes two such measures. The B indicator excludes unprocessed food, energy, alcoholic beverages, tobacco and gold, and the C indicator also excludes processed food and non-alcoholic beverages. In October B rose by 2.00% on the month and 28.46% on the year, and C by 2.07% and 28.28% (TÜİK, 2026a). According to the data, both annual rates are the lowest since November 2021, when they were 19.75% and 17.62%. Headline inflation was 1.31 points above B in October. The data also show where part of the gap comes from: energy, which B leaves out, rose by about 54% on the year, as the section on the contributions of the groups shows below.
Figure 1a shows the three rates since 2005, with six episodes marked: the global financial crisis (Lehman Brothers filed for bankruptcy on 15 September 2008, Financial Crisis Inquiry Commission, 2011), the rapid depreciation of the lira in early August 2018 (CBRT, 2019), the declaration of COVID-19 as a pandemic on 11 March 2020 (World Health Organization, 2020), the start of the policy-rate cuts in September 2021 (CBRT, 2026a), Russia's invasion of Ukraine in February 2022 (International Monetary Fund, 2022) and the start of the monetary tightening in June 2023 (CBRT, 2026a). Annual inflation stayed between 3.99% and 12.98% from 2005 to 2017, and the two large breaks come after August 2018 and after September 2021. The regARIMA model used for the seasonal adjustment below detects the same breaks in the price level without being told where they are. Its largest interventions are a level shift in December 2021 (t = 17.74), a level shift in August 2023 (t = 11.24) and a temporary change in September 2018 (t = 9.13).2
How much of October is seasonal?
Monthly price changes contain a seasonal pattern that recurs every year (Eurostat, 2024). In October 2026, for example, clothing and footwear rose by 12.58% on the month (TÜİK, 2026a). TÜİK publishes its own seasonally adjusted CPI, so the author's estimates here are a cross-check of the official series, not a substitute for it. They were produced under stated conditions: the X-13ARIMA-SEATS program of the U.S. Census Bureau (2017), applied to the log of the headline index from January 2005 to October 2026, an airline model with automatic detection of outliers (Findley et al., 1998), and seasonal factors re-estimated with the latest month included. Trading-day effects were tested and rejected: the program's AICC criterion prefers the model without trading-day regressors. Moving religious holidays, which in Türkiye are the Ramadan and Sacrifice holidays, are not modelled, because the program's built-in holiday regressors cover only Easter and two US holidays and these holidays would require user-defined regressors with official dates. Any effect they have therefore stays in the seasonal and irregular components. The same model is decomposed in two ways, with the X-11 moving-average filters (Ladiray & Quenneville, 2001) and with the model-based SEATS method (Gómez & Maravall, 1996), which correspond to the two approaches named in the ESS guidelines on seasonal adjustment, moving-average filters and ARIMA-model-based signal extraction (Eurostat, 2024, item 5.2).2 On this basis October's seasonally adjusted increase is 2.32% (X-11) or 2.36% (SEATS), about a quarter of a point below the unadjusted 2.58% (Figure 1b). Over the last three months the seasonally adjusted index rose at an annualised rate of 27.9% (X-11) or 28.9% (SEATS), only one to two points below the annual rate of 29.77%.
An official producer makes several further choices, each covered by the guidelines: the calendar adjustment, including national and moving religious holidays (items 4.1–4.4), the treatment of outliers (item 4.6), whether to adjust the headline index directly or to aggregate separately adjusted components (items 5.4–5.5), and the revision policy (chapter 6) (Eurostat, 2024). TÜİK's release metadata do not state these choices, so its official figures and the estimates here need not coincide month by month, and the official series remains the reference. The same guidelines ask producers to publish their seasonal adjustment methods, software versions and options as metadata in a standard format (Eurostat, 2024, items 3.1, 3.5 and 3.6). In practice the two sets of estimates are already close. From February 2005 to September 2026 the author's monthly seasonally adjusted changes differ from TÜİK's by 0.22 points on average with X-11 and 0.20 with SEATS (mean absolute difference), the correlation between the two is 0.99 with either method, and the average signed difference is almost zero (0.003 and 0.005 points). Since January 2024 the largest difference is in January 2026 (0.66 points with X-11), the month in which TÜİK's table shows 2.95% against 2.29% here. For September 2026 TÜİK's figure is 1.61%, against 1.70% (X-11) and 1.78% (SEATS). TÜİK's seasonally adjusted table, published separately, still ended in September on 3 November. All seasonally adjusted figures for the latest months are revised as new data arrive. The model's diagnostics also call for caution about recent years: there is no residual seasonality over the whole span, but some over the last eight years, and the residuals still show some autocorrelation.2
Which groups drove the change?
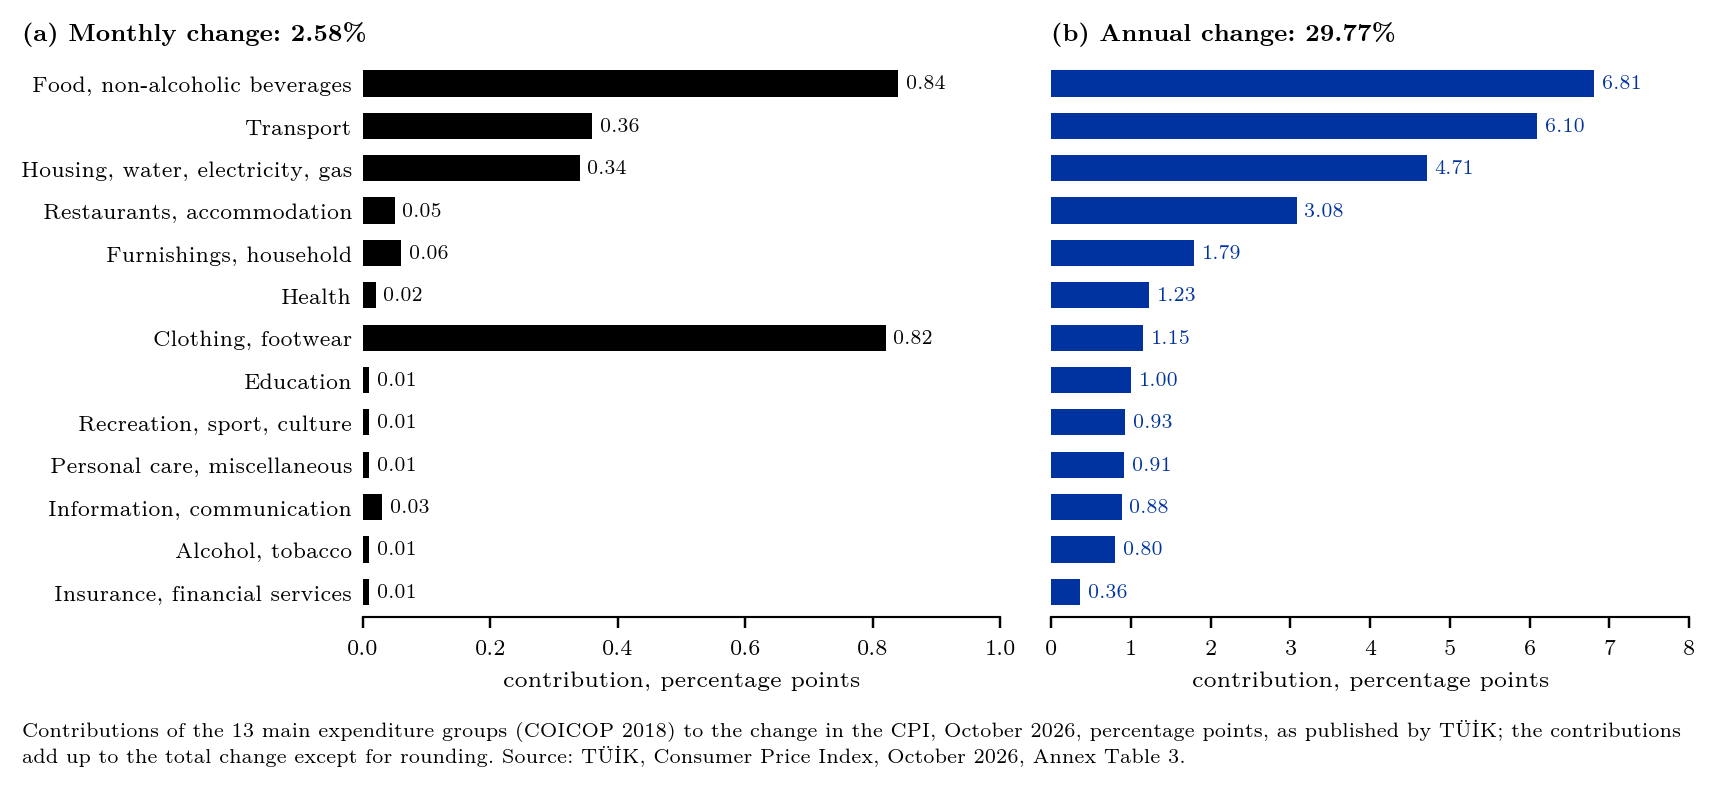
TÜİK's CPI is a chain-linked Laspeyres index whose weights and basket are renewed every December, and the release gives each group's contribution to the monthly and annual change. The contributions add up to the change in the index except for rounding (TÜİK, 2026a). Of the 29.77% annual increase, food and non-alcoholic beverages contributed 6.81 points, transport 6.10, housing 4.71 and restaurants and accommodation 3.08 (Table 1, Figure 2b). In the month, food (0.84 points), clothing (0.82), transport (0.36) and housing (0.34) together account for 2.36 of the 2.58 points (Figure 2a).
Table 1. Türkiye, CPI by main expenditure group (COICOP 2018), October 2026. Weight in %, change in %, contribution to the change in the CPI in percentage points (TÜİK, 2026a).
| Group | Weight | Monthly change | Monthly contribution | Annual change | Annual contribution |
|---|---|---|---|---|---|
| CPI | 100.00 | 2.58 | 2.58 | 29.77 | 29.77 |
| Food and non-alcoholic beverages | 24.44 | 3.50 | 0.84 | 27.73 | 6.81 |
| Alcoholic beverages and tobacco | 2.75 | 0.18 | 0.01 | 28.73 | 0.80 |
| Clothing and footwear | 7.90 | 12.58 | 0.82 | 13.38 | 1.15 |
| Housing, water, electricity, gas and other fuels | 11.40 | 2.84 | 0.34 | 40.24 | 4.71 |
| Furnishings and household equipment | 7.92 | 0.82 | 0.06 | 23.00 | 1.79 |
| Health | 2.79 | 0.50 | 0.02 | 43.29 | 1.23 |
| Transport | 16.62 | 2.02 | 0.36 | 36.39 | 6.10 |
| Information and communication | 3.10 | 1.15 | 0.03 | 27.33 | 0.88 |
| Recreation, sport and culture | 4.34 | 0.33 | 0.01 | 23.21 | 0.93 |
| Education services | 2.02 | 0.24 | 0.01 | 48.86 | 1.00 |
| Restaurants and accommodation services | 11.13 | 0.47 | 0.05 | 28.42 | 3.08 |
| Insurance and financial services | 1.07 | 0.59 | 0.01 | 31.41 | 0.36 |
| Personal care and miscellaneous | 4.49 | 0.32 | 0.01 | 20.86 | 0.91 |
Energy and food are the main items that TÜİK's C indicator leaves out (TÜİK, 2026a). Table 2 shows the main energy and food items, together with rents, at the most detailed level TÜİK publishes. TÜİK does not publish contributions for these subclasses, so the last column uses the weight times the annual change, a fixed-weight approximation. At the level of the 13 groups this approximation is within 0.12 points of TÜİK's published contributions.3 The nine energy subclasses, 6.41% of the basket, were about 54.0% more expensive than a year earlier, and together they account for roughly 3.5 points of annual inflation. Diesel rose by 76.59% and natural gas by 60.62%. Rents paid by tenants rose by 39.71% and contributed about 2.7 points, more than any other single subclass.
Table 2. Türkiye, CPI, selected subclasses (COICOP 2018, 5-digit), October 2026. Weight in %, change in %, approximate contribution to the annual change in percentage points (TÜİK, 2026a, author's calculations).
| Subclass | Weight | Monthly change | Annual change | Approximate annual contribution |
|---|---|---|---|---|
| Diesel | 1.3919 | 5.03 | 76.59 | 1.07 |
| Petrol | 1.2364 | 3.51 | 54.30 | 0.67 |
| Other fuels for personal transport equipment | 0.5801 | 18.01 | 50.21 | 0.29 |
| Natural gas through networks | 1.0818 | 1.47 | 60.62 | 0.66 |
| Electricity | 1.2737 | 0.38 | 27.77 | 0.35 |
| Liquefied hydrocarbons (LPG cylinders) | 0.3227 | 8.25 | 50.62 | 0.16 |
| Energy, nine subclasses | 6.4073 | 5.48 | 53.98 | 3.46 |
| Actual rentals paid by tenants | 6.7638 | 2.55 | 39.71 | 2.69 |
| Bread and bakery products | 3.3873 | 0.82 | 22.89 | 0.78 |
| Meat, fresh, chilled or frozen | 3.6716 | 2.07 | 36.67 | 1.35 |
| Cheese | 1.4972 | 2.49 | 38.62 | 0.58 |
| Fruit-bearing vegetables, fresh or chilled | 1.3306 | 26.77 | 41.04 | 0.55 |
The nine energy subclasses are electricity, natural gas, liquefied hydrocarbons, coal, wood fuel, diesel, petrol, other fuels and lubricants. Their monthly and annual changes in the bold row are weighted averages of the subclass changes with the 2026 weights.
Producer and consumer prices
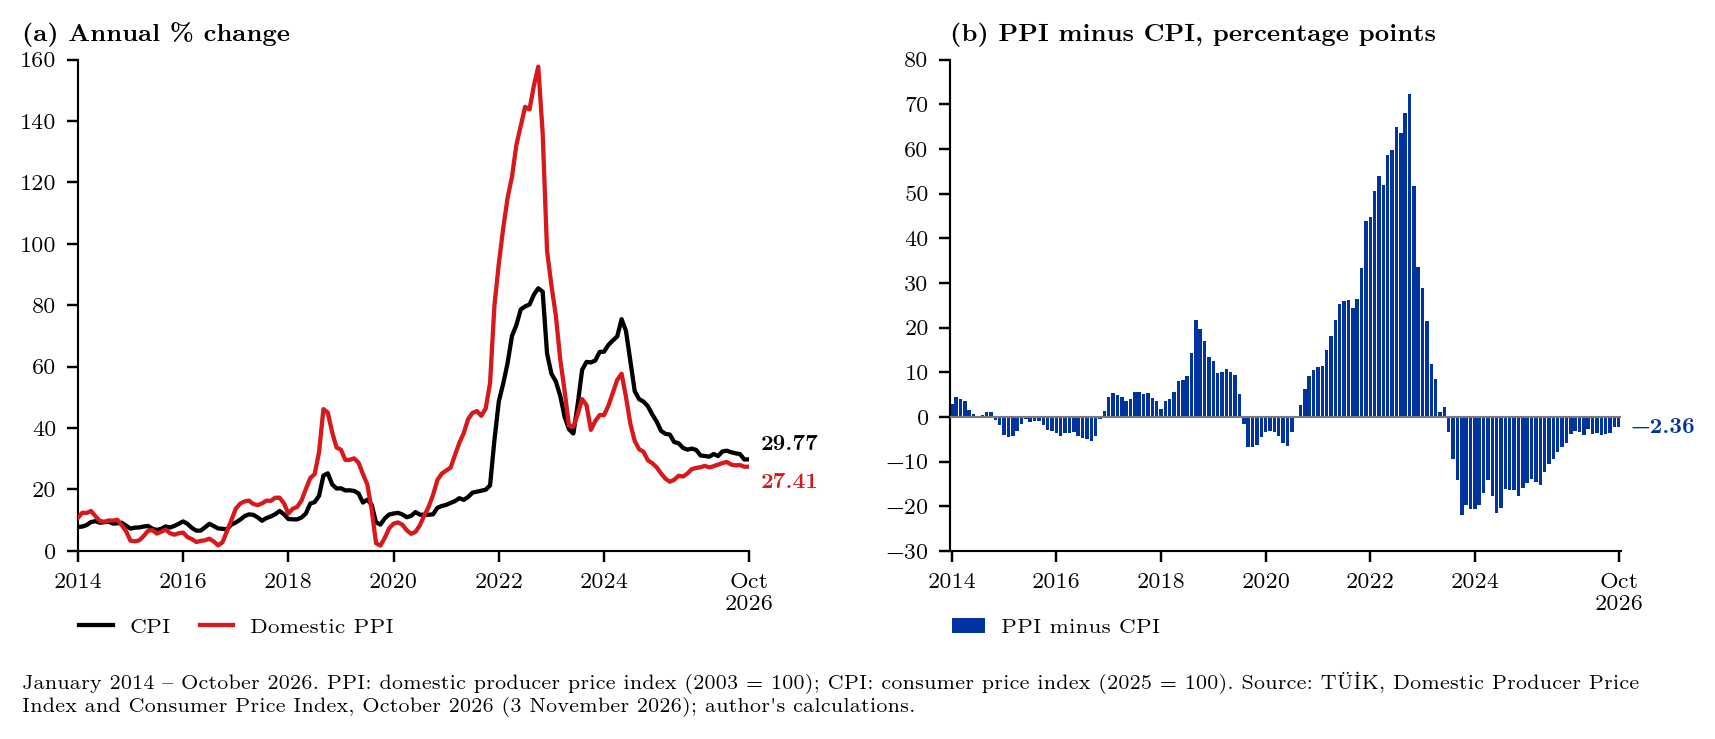
TÜİK's domestic producer price index (PPI) rose by 1.65% in October and by 27.41% on a year earlier (TÜİK, 2026b), 2.36 points below consumer inflation. Producer prices cover goods at the factory gate, including intermediate goods and energy, and so register cost pressures before they reach the shelf. Clark (1995) found, however, that in the United States producer prices did not consistently help to predict consumer prices, so the gap is read here as a description of cost pressures, not as a forecast. Annual PPI inflation was as much as 72.18 points above consumer inflation in October 2022 and has been below it for 40 consecutive months since July 2023 (Figure 3). At its widest the gap was −21.97 points, in October 2023, and it has narrowed to −2.36: producer prices are no longer rising much more slowly than consumer prices.
Real interest rate
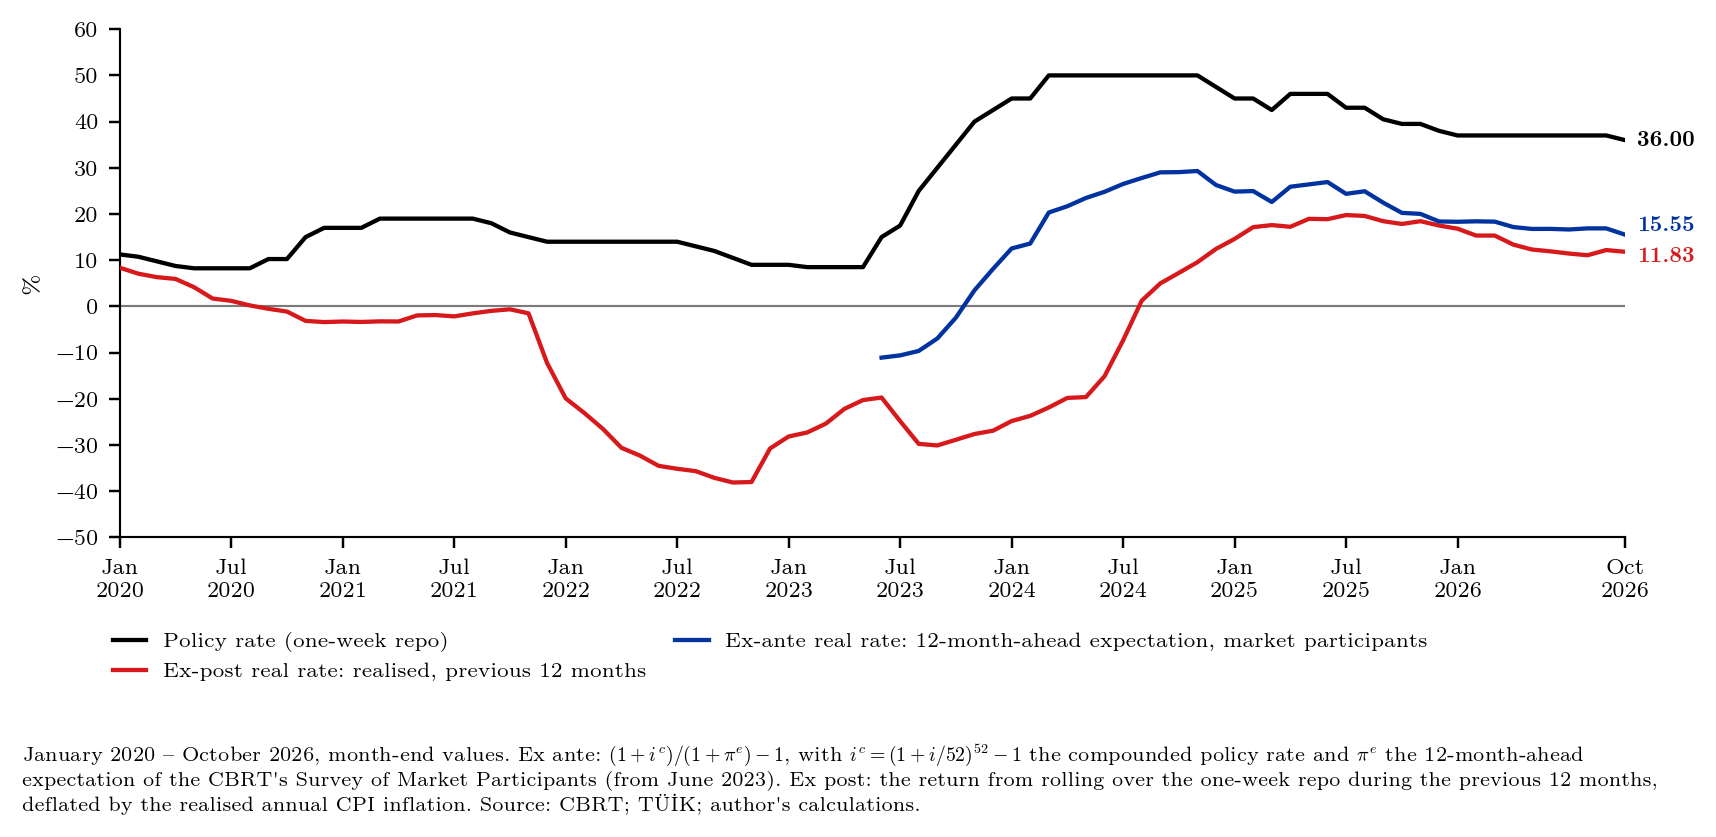
Fisher's (1930) relation links the nominal interest rate $i$ to the real rate $r$ and expected inflation: $(1 + i) = (1 + r)(1 + \pi^e)$. The ex-ante real rate uses expected inflation, while the ex-post real rate uses inflation as it turned out and differs from the ex-ante rate by the expectation error (Mishkin, 1981). With the one-week repo rate of 36%, 43.16% when compounded weekly, and the market participants' 12-month-ahead expectation of 23.89%, the ex-ante real policy rate at the end of October is 15.55% (Figure 4).4 Without compounding it is 9.77%. This figure assumes that the policy rate stays at 36% for the next twelve months. In Mishkin's definition the ex-post real rate is the return realised over a holding period less the inflation realised over the same period, so the latest one that can be computed covers the twelve months to October 2026. Rolling over the one-week repo at the policy rates in force during those months returned 45.12%, and with realised inflation of 29.77% the ex-post real rate was 11.83%. In October 2025 the ex-ante rate for the same twelve months was 20.25%, with a policy rate of 39.5% and an expectation of 23.26%. The ex-post rate turned out 8.42 points lower: inflation was 6.51 points above the expectation, and the policy rate was lowered from 39.5% to 36% during the period. Measured in this way, the ex-post real rate was negative in 46 of the 54 months from January 2020 to June 2024, reaching −38.12% in the twelve months to October 2022, and it has been positive in every month since August 2024. The ex-post rate describes twelve months that have ended; the ex-ante rate refers to the twelve months ahead.
A restricted basket of necessities
Poorer households spend a larger share of their budget on food, the regularity known as Engel's law (Houthakker, 1957), and inflation tends to hurt the poor more than the rich (Easterly & Fischer, 2001). Table 3 groups food and non-alcoholic beverages, rents, water, electricity and natural gas, which make up 34.22% of the CPI basket. Weighted with the CPI's own weights, this restricted basket rose by about 31.1% on the year and 3.09% on the month, against 29.77% and 2.58% for the CPI as a whole. This is an illustration, not an index for low-income households. The weights are those of the average household, rent concerns only tenants, and the fixed-weight method is an approximation. Applied to the 13 groups, it gives 29.58% for the annual change of the CPI against the published 29.77%, an error of 0.19 points, and 2.72% for the monthly change against 2.58%, an error of 0.14 points.3
Table 3. Türkiye, restricted basket of necessities, October 2026. Weight in the CPI in %, change in % (TÜİK, 2026a, basket totals: author's calculations).
| Item | Weight | Monthly change | Annual change |
|---|---|---|---|
| Food and non-alcoholic beverages | 24.44 | 3.50 | 27.73 |
| Actual rentals paid by tenants | 6.7638 | 2.55 | 39.71 |
| Water supply | 0.6621 | 1.36 | 24.29 |
| Electricity | 1.2737 | 0.38 | 27.77 |
| Natural gas through networks | 1.0818 | 1.47 | 60.62 |
| Restricted basket | 34.2214 | 3.09 | 31.07 |
| CPI | 100.00 | 2.58 | 29.77 |
Türkiye among emerging markets
For September 2026, the latest month published by all the statistical offices below, Türkiye's annual inflation of 29.73% was 23.44 points above the next highest in the group, Colombia's 6.29% (Table 4). The comparison uses each country's national CPI as published by its statistical office, and India's figure is provisional.
Table 4. Annual consumer price inflation, September 2026, %, national CPIs.
| Country | Annual change | Source |
|---|---|---|
| Türkiye | 29.73 | TÜİK (2026c) |
| Colombia | 6.29 | DANE (2026) |
| India | 5.54 | MoSPI, via PIB (2026) |
| Brazil | 4.58 | IBGE (2026) |
| South Africa | 4.5 | Stats SA, via SAnews (2026) |
| Chile | 4.1 | INE (2026) |
| Poland | 4.1 | Statistics Poland (2026) |
| Mexico | 3.45 | INEGI (2026) |
| Indonesia | 3.28 | BPS-Statistics Indonesia (2026) |
| Hungary | 1.6 | KSH (2026) |
| China | 0.9 | NBS (2026) |
On TÜİK's data, then, inflation has come down. Headline and core annual rates are well below a year ago, and core is at its lowest since 2021. The seasonally adjusted monthly pace, about 2.3–2.4% in October and an annualised 28–29% over three months, shows that the decline has slowed, and energy, rents and the basket of necessities are still rising faster than the index as a whole.5
References
BPS-Statistics Indonesia. (2026, October 1). Series of consumer price index September 2026 (Official Statistics News No. 94/10/Th. XXIX). https://www.bps.go.id/id/pressrelease/2026/10/01/2623/inflasi-year-on-year--y-on-y--pada-september-2026-sebesar-3-28-persen-
Bryan, M. F., & Cecchetti, S. G. (1994). Measuring core inflation. In N. G. Mankiw (Ed.), Monetary policy (pp. 195–215). University of Chicago Press.
Central Bank of the Republic of Türkiye. (2019). Annual report 2018. https://www3.tcmb.gov.tr/yillikrapor/2018/en/m-2-1.html
Central Bank of the Republic of Türkiye. (2026a). 1 week repo (data set). Retrieved November 3, 2026, from https://www.tcmb.gov.tr/wps/wcm/connect/EN/TCMB+EN/Main+Menu/Core+Functions/Monetary+Policy/Central+Bank+Interest+Rates/1+Week+Repo
Central Bank of the Republic of Türkiye. (2026b). Electronic Data Delivery System (EVDS) (data set): Survey of Market Participants, series TP.PKAUO.S01.A.U and TP.PKAUO.S01.E.U. Retrieved October 2026, from https://evds3.tcmb.gov.tr
Clark, T. E. (1995). Do producer prices lead consumer prices? Economic Review, Federal Reserve Bank of Kansas City, 80(3), 25–39.
Departamento Administrativo Nacional de Estadística. (2026). Principales resultados: IPC, septiembre 2026 (in Spanish; English title: Main results: CPI, September 2026; press release). https://www.dane.gov.co/files/operaciones/IPC/sep2026/press-IPC-sep2026.pdf
Easterly, W., & Fischer, S. (2001). Inflation and the poor. Journal of Money, Credit and Banking, 33(2), 160–178.
Eurostat. (2024). ESS guidelines on seasonal adjustment (2024 ed.). Publications Office of the European Union. https://doi.org/10.2785/705102
Financial Crisis Inquiry Commission. (2011). The financial crisis inquiry report. U.S. Government Printing Office.
Findley, D. F., Monsell, B. C., Bell, W. R., Otto, M. C., & Chen, B.-C. (1998). New capabilities and methods of the X-12-ARIMA seasonal-adjustment program. Journal of Business & Economic Statistics, 16(2), 127–152.
Fisher, I. (1930). The theory of interest. Macmillan.
Gómez, V., & Maravall, A. (1996). Programs TRAMO and SEATS (Working Paper No. 9628). Banco de España.
Houthakker, H. S. (1957). An international comparison of household expenditure patterns, commemorating the centenary of Engel's law. Econometrica, 25(4), 532–551.
Instituto Brasileiro de Geografia e Estatística. (2026). IPCA - Variação acumulada em 12 meses (in Portuguese; English title: IPCA – Change accumulated over 12 months) (data set). SIDRA, table 1737. Retrieved November 3, 2026, from https://apisidra.ibge.gov.br/values/t/1737/n1/all/v/63%2C2265/p/last%2012
Instituto Nacional de Estadística. (2026, October 8). Índice de Precios al Consumidor (IPC) de septiembre presentó una variación mensual de 0,4% (in Spanish; English title: The Consumer Price Index (CPI) for September showed a monthly change of 0.4%). https://www.ine.gob.cl/sala-de-prensa/prensa/general/noticia/2026/10/08/%C3%ADndice-de-precios-al-consumidor-%28ipc%29-de-septiembre-present%C3%B3-una-variaci%C3%B3n-mensual-de-0-4
Instituto Nacional de Estadística y Geografía. (2026, October 8). Índice Nacional de Precios al Consumidor (INPC) (in Spanish; English title: National Consumer Price Index (INPC); Boletín de Indicador 619/26). https://www.inegi.org.mx/contenidos/saladeprensa/boletines/2026/inpc/inpc_2q2026_10.pdf
International Monetary Fund. (2022). World economic outlook: War sets back the global recovery (April 2022). https://www.imf.org/en/Publications/WEO/Issues/2022/04/19/world-economic-outlook-april-2022
Központi Statisztikai Hivatal. (2026). HCSO monitor: Prices. Retrieved November 3, 2026, from https://www.ksh.hu/hcso-monitor/prices.html
Ladiray, D., & Quenneville, B. (2001). Seasonal adjustment with the X-11 method (Lecture Notes in Statistics, Vol. 158). Springer.
Mishkin, F. S. (1981). The real interest rate: An empirical investigation. Carnegie-Rochester Conference Series on Public Policy, 15, 151–200.
National Bureau of Statistics of China. (2026, October 14). 2026年9月份居民消费价格同比上涨0.9% (in Chinese; English title: Consumer prices in September 2026 rose 0.9% year on year). https://www.stats.gov.cn/sj/zxfb/202610/t20261014_1965477.html
Press Information Bureau. (2026, October 12). Press release of consumer price index on base 2024=100 for September, 2026 (Ministry of Statistics and Programme Implementation). https://www.pib.gov.in/PressReleasePage.aspx?PRID=2322244
South African Government News Agency. (2026, October 21). CPI rises in September. https://www.sanews.gov.za/node/85109
Statistics Poland. (2026, October 14). Consumer price indices in September 2026 (news release). https://publikacje.new.stat.gov.pl/en/publications-portal/consumer-price-indices-september-2026
Turkish Statistical Institute. (2026a, November 3). Tüketici fiyat endeksi, Ekim 2026 (in Turkish; English title: Consumer price index, October 2026; No. 58291). https://veriportali.tuik.gov.tr/tr/press/58291
Turkish Statistical Institute. (2026b, November 3). Yurt içi üretici fiyat endeksi, Ekim 2026 (in Turkish; English title: Domestic producer price index, October 2026; No. 58035). https://veriportali.tuik.gov.tr/tr/press/58035
Turkish Statistical Institute. (2026c, October 5). Tüketici fiyat endeksi, Eylül 2026 (in Turkish; English title: Consumer price index, September 2026; No. 58298). https://veriportali.tuik.gov.tr/tr/press/58298
U.S. Census Bureau. (2017). X-13ARIMA-SEATS reference manual (Version 1.1). Time Series Research Staff, Center for Statistical Research and Methodology.
World Health Organization. (2020, March 11). WHO Director-General's opening remarks at the media briefing on COVID-19. https://www.who.int/director-general/speeches/detail/who-director-general-s-opening-remarks-at-the-media-briefing-on-covid-19---11-march-2020
Notes
-
Data. CPI (2025 = 100) with monthly and annual changes, the B and C indicators, the domestic PPI (annual change, from January 2014) and TÜİK's seasonally adjusted monthly changes, January 2005 – October 2026, from the tables of the CPI and PPI releases of 3 November 2026 (TÜİK, 2026a, 2026b): monthly data (CSV). Main expenditure groups, October 2026: groups (CSV). The 174 subclasses with their 2026 weights: subclasses (CSV). One-week repo rate changes since May 2010 (CBRT, 2026a): policy rate (CSV). Market participants' expectations (CBRT, 2026b): 12-month-ahead (CSV), current month (CSV). Other countries: peers (CSV). With $m_t$ the monthly change, the annual rate obeys $1 + \pi^{12}_t = (1 + \pi^{12}_{t-1})(1 + m_t)/(1 + m_{t-12})$, so $1.2973 \times 1.0258/1.0255 = 1.29768$, i.e. 29.77%. The workbook lists every number in the note next to the formula that produces it and a check against the text, so that readers who wish to examine the calculations can follow and audit them in a spreadsheet without losing time and without running any code. The code that draws the figures and repeats the same calculations is available on request. The English titles of the references written in Chinese, Portuguese and Spanish were translated with DeepL; the original titles are given as published. ↑
-
Seasonal adjustment (author's). X-13ARIMA-SEATS, version 1.1, build 61, on the CPI from January 2005 to October 2026, with a log transformation, an ARIMA $(0\,1\,1)(0\,1\,1)_{12}$ model, automatic detection of additive outliers, level shifts and temporary changes, and decomposition with X-11 and, separately, with SEATS. Trading days: the AICC test (aictest=(td)) gives −175.01 without trading-day regressors, against −71.76 with six and −76.94 with one, and keeps the model without them. Moving holidays: the built-in holiday regressors of X-13ARIMA-SEATS are Easter, Labor Day and Thanksgiving (U.S. Census Bureau, 2017), none of which applies to Türkiye, and no user-defined regressors for the Ramadan and Sacrifice holidays were built. The airline model is used in both runs because, with the model selected automatically, $(1\,1\,0)(0\,1\,1)_{12}$, SEATS reports an inadmissible decomposition. With one model the two runs differ only in the decomposition. Results: seasonally adjusted series and factors (CSV) and outliers (CSV). The script that writes the specification files and runs the program is
writing/figures/turkiye_cpi_2026_10_sa.py. The t-values are those of the program's regression table. Annualised three-month rate: $((SA_{\text{Oct}}/SA_{\text{Jul}})^4 - 1) \times 100$. Comparison with TÜİK: mean of $|d_t|$, mean of $d_t$ and correlation over the 260 months from February 2005 to September 2026, with $d_t$ the author's seasonally adjusted monthly change minus TÜİK's. The correlations are 0.986 (X-11) and 0.988 (SEATS). Diagnostics of the regARIMA residuals: QS test for residual seasonality 0.00 over the whole span (p = 1.00) and 6.90 from November 2018 (p = 0.03). Ljung–Box test on the 249 residuals from February 2006, $Q(12) = 20.47$ ($p = 0.025$) and $Q(24) = 35.97$ ($p = 0.031$), with two estimated ARMA parameters. Results of the tests: diagnostics (CSV) and residuals (CSV). ↑↑↑ -
Fixed-weight approximations (author's). The approximate contribution of a subclass, with $w_i$ its 2026 weight and $\pi_i$ its annual change, and the change of a basket: $$\frac{w_i \pi_i}{100}, \qquad \frac{\sum w_i \pi_i}{\sum w_i}$$ TÜİK's chain-linked index weights each item by its expenditure share updated for price changes since December, so these are approximations. Applied to the 13 groups, $\sum w_i \pi_i / \sum w_i = 29.58$ against the published 29.77 and, for the monthly change, 2.72 against 2.58 (the published group weights add up to 99.97 because of rounding), and the largest difference from a published group contribution is 0.12 points (housing, 4.59 against 4.71). Energy: $\sum w_i = 6.4073$ and $\sum w_i \pi_i / \sum w_i = 53.98$. Restricted basket: $$\frac{24.44 \times 27.73 + 6.7638 \times 39.71 + 0.6621 \times 24.29 + 1.2737 \times 27.77 + 1.0818 \times 60.62}{34.2214} = 31.07$$ ↑↑
-
Real rates (author's). Compounded policy rate: $$i^c = \left(1 + \frac{0.36}{52}\right)^{52} - 1 = 43.16\%$$ Ex ante, October 2026: $$\left(\frac{1.43155}{1.2389} - 1\right) \times 100 = 15.55$$ Without compounding: $$\left(\frac{1.36}{1.2389} - 1\right) \times 100 = 9.77$$ Ex post, following Mishkin (1981), is the return realised over the holding period less the inflation of the same period. For the twelve months ending in month $T$ the realised return $R_T$ is $$1 + R_T = \exp\left(\sum_s \frac{d_s}{D}\, 52 \ln\left(1 + \frac{i_s}{52}\right)\right)$$ where $i_s$ are the policy rates in force from the first day after month $T-12$ to the last day of month $T$, $d_s$ the number of days each was in force and $D$ the number of days in the window; with a constant rate this equals $(1 + i/52)^{52}$. From 1 November 2025 to 31 October 2026 the rate was 39.5% for 41 days, 38% for 42, 37% for 273 and 36% for 9 of the 365 days, which gives $R = 45.12\%$ and $$\left(\frac{1.45118}{1.2977} - 1\right) \times 100 = 11.83$$ October 2025, ex ante, with $i^c = 48.22\%$: $$\left(\frac{1.48217}{1.2326} - 1\right) \times 100 = 20.25$$ Differences used in the text: $$11.83 - 20.25 = -8.42, \qquad 29.77 - 23.26 = 6.51$$ The calculation treats the one-week repo rate as the return of an investor who rolls it over at the policy rate; it is not the return on any traded instrument. Annual CPI inflation compares monthly average price levels, so the inflation window and the return window coincide only approximately. The policy rate of a month is the rate in force on its last day, and the CBRT's table gives the dates on which each rate took effect. ↑
-
Author's note. This note describes the data and does not test explanations. Since 2005, the first year of the series used here, annual CPI inflation in Türkiye has ranged from 3.99% (March 2011) to 85.51% (October 2022). It was below 10% in 126 of the 262 months, for the last time in October 2019. It reached 20% for the first time in the series in September 2018, and it has been 20% or more in every month since November 2021, 60 months in a row. After more than two decades, the general rise in prices is still several times that of the other emerging economies in Table 4, whose annual rates were between 0.9% and 6.29% in September 2026, although they face the same global shocks. Public debate in Türkiye points to several possible reasons: international relations and diplomacy, cyclical swings, fragile scenarios in neighbouring countries, and the weight of interest groups in exchange-rate and interest-rate policy. Which of these matter, and how much, cannot be settled with the data in this note. Other economies have shown that inflation can be brought down and kept low, so why Türkiye has not yet done so remains a question open to discussion. This note relies on official data and on international methodological references. A review of the national literature on Turkish inflation, including the research of the CBRT, will accompany the follow-up note that models CPI inflation. ↑