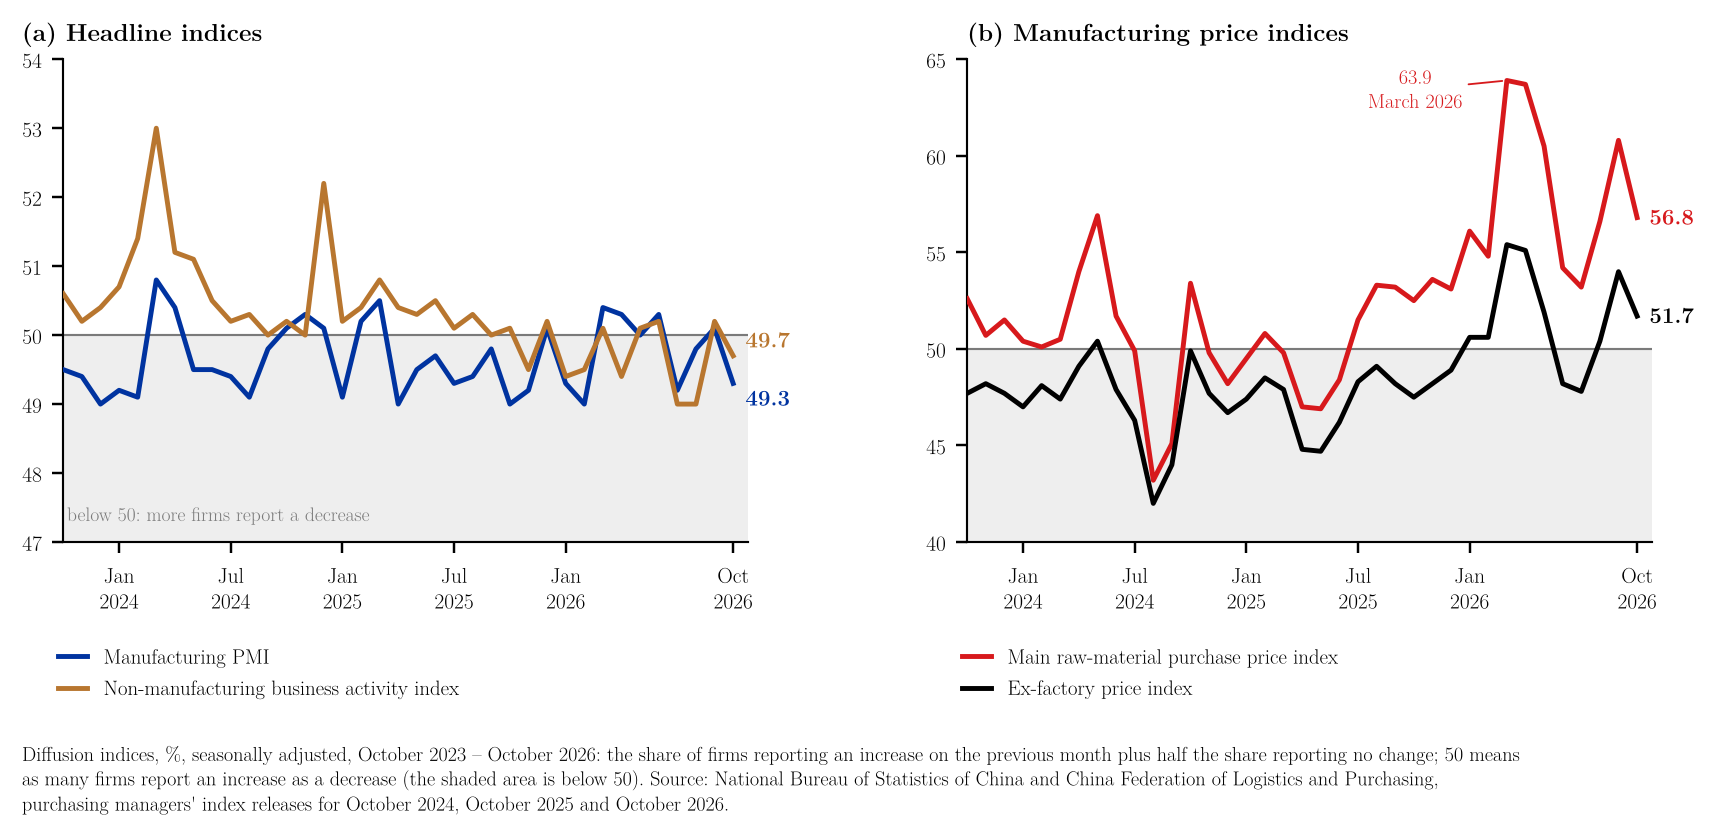
The National Bureau of Statistics of China (NBS) and the China Federation of Logistics and Purchasing (CFLP) reported on 31 October that the manufacturing purchasing managers' index (PMI) fell by 0.8 points to 49.3 in October 2026, the non-manufacturing business activity index by 0.5 points to 49.7, and the composite PMI output index by 1.0 point to 49.7 (NBS & CFLP, 2026).1 A PMI is compiled from a monthly survey of purchasing managers: each sub-index is the share of firms reporting an increase on the previous month plus half the share reporting no change, so a reading above 50 means more firms report an increase than a decrease, and a reading below 50 the reverse (NBS & CFLP, 2026, note 4; Baumohl, 2012, chs. 3–4). Because it counts firms, the index shows how widespread a change is, not how large it is. The manufacturing PMI is a weighted average of five sub-indices: new orders (30%), production (25%), employment (20%), supplier delivery times (15%, inverted) and raw-material inventory (10%) (NBS & CFLP, 2026, note 4). Recomputed from the published sub-indices, it matches the published value to within 0.05 points in each of the 37 months from October 2023 to October 2026.2
Table 1. China, purchasing managers' indices, October 2026, %, seasonally adjusted, and change on September 2026, percentage points.3
| Index | October 2026 | Change on September |
|---|---|---|
| Manufacturing PMI | 49.3 | −0.8 |
| Large enterprises | 50.2 | −0.4 |
| Medium-sized enterprises | 48.4 | −1.3 |
| Small enterprises | 47.5 | −1.4 |
| Production | 49.8 | −1.9 |
| New orders | 49.4 | −1.1 |
| New export orders | 48.7 | −1.3 |
| Employment | 48.4 | 0.0 |
| Main raw-material purchase prices | 56.8 | −4.0 |
| Ex-factory prices | 51.7 | −2.3 |
| Non-manufacturing business activity | 49.7 | −0.5 |
| Construction | 48.0 | −2.3 |
| Services | 50.0 | −0.2 |
| New orders, non-manufacturing | 44.4 | −2.1 |
| New orders, construction | 40.0 | −5.7 |
| Composite PMI output index | 49.7 | −1.0 |
In manufacturing, the production and new orders indices moved below 50 and the new export orders index fell from 50.0 to 48.7; the index for large enterprises stayed above 50 while those for medium-sized and small enterprises fell further below it (Table 1). Over the 37 months from October 2023, the manufacturing PMI was 50 or above in 13 months and ranged from 49.0 to 50.8; in 2026 it was 50 or above in 5 of the 10 months (Figure 1a). The non-manufacturing index was below 50 in 7 of the 37 months, all of them since November 2025, and its new orders index was below 50 in every month. In October the construction index fell by 2.3 points to 48.0 and construction new orders by 5.7 points to 40.0, while the services index was 50.0. The main raw-material purchase price index fell from 60.8 to 56.8, below its March 2026 value of 63.9, the highest of the 37 months; the ex-factory price index fell to 51.7 and has been above 50 in 8 of the 10 months of 2026, against once in the 27 months before (Figure 1b). A price index above 50 means that more firms reported higher prices than lower ones; it is not a rate of price change. All counts and "highest" statements here refer to the 37 months from October 2023 collected for this note; earlier months were not examined. The release describes the manufacturing reading as a moderate decline (制造业景气水平有所回落) and does not give reasons; this note describes the published indices and does not attribute the changes.
References
Baumohl, B. (2012). The secrets of economic indicators: Hidden clues to future economic trends and investment opportunities (3rd ed.). FT Press.
National Bureau of Statistics of China. (2024). Purchasing managers' index for October 2024. https://www.stats.gov.cn/english/PressRelease/202411/t20241115_1957434.html
National Bureau of Statistics of China. (2025). Purchasing managers' index for October 2025. https://www.stats.gov.cn/english/PressRelease/202511/t20251103_1961770.html
National Bureau of Statistics of China & China Federation of Logistics and Purchasing. (2026, October 31). 2026年10月中国采购经理指数运行情况 (in Chinese; English title: Purchasing managers' index for October 2026). https://www.stats.gov.cn/sj/zxfb/202610/t20261031_1965718.html
Notes
-
The figures for October 2026, the breakdown by enterprise size and the construction and services indices are taken from the Chinese release of 31 October 2026, text and Tables 1–4; the English version had not been posted when this note was written. The definitions, the survey coverage (3,200 manufacturing and 4,300 non-manufacturing enterprises) and the weights of the manufacturing PMI are from note 4 of the same release, which also states that all published indices are seasonally adjusted. The English title of the Chinese release in the reference list was translated from Chinese with DeepL; the Chinese title is given as published. ↑
-
Calculations (author's). Manufacturing PMI recomputed from the five published sub-indices, where $N$ is new orders, $P$ production, $E$ employment, $S$ supplier delivery times and $I$ raw-material inventory: $$0.30\,N_t + 0.25\,P_t + 0.20\,E_t + 0.15\,(100 - S_t) + 0.10\,I_t$$ October 2026, against a published 49.3: $$0.30 \times 49.4 + 0.25 \times 49.8 + 0.20 \times 48.4 + 0.15 \times (100 - 50.2) + 0.10 \times 48.4 = 49.26$$ The largest absolute difference in the 37 months is 0.045 points, which is within the rounding of the published sub-indices to one decimal. Counts refer to October 2023 – October 2026 (37 months); "50 or above" includes readings of exactly 50.0. ↑
-
Monthly indices, October 2023 – October 2026, from Tables 1–4 of the releases for October 2024 and October 2025 (English) and October 2026 (Chinese) (National Bureau of Statistics of China, 2024, 2025; NBS & CFLP, 2026); the months that appear in two releases are identical in both: data (CSV). October 2026 values by enterprise size and for construction, services and the composite index, with their published changes: data (CSV). In Table 1 the changes for the size, construction, services and composite rows are as published; the others are differences between the October and September values in the release, which equal the published changes where the text gives them. The workbook lists every number in the note next to the formula that produces it and a check against the text, so that readers who wish to examine the calculations can follow and audit them in a spreadsheet without losing time and without running any code. The code that draws the figure and repeats the same calculations is available on request. ↑