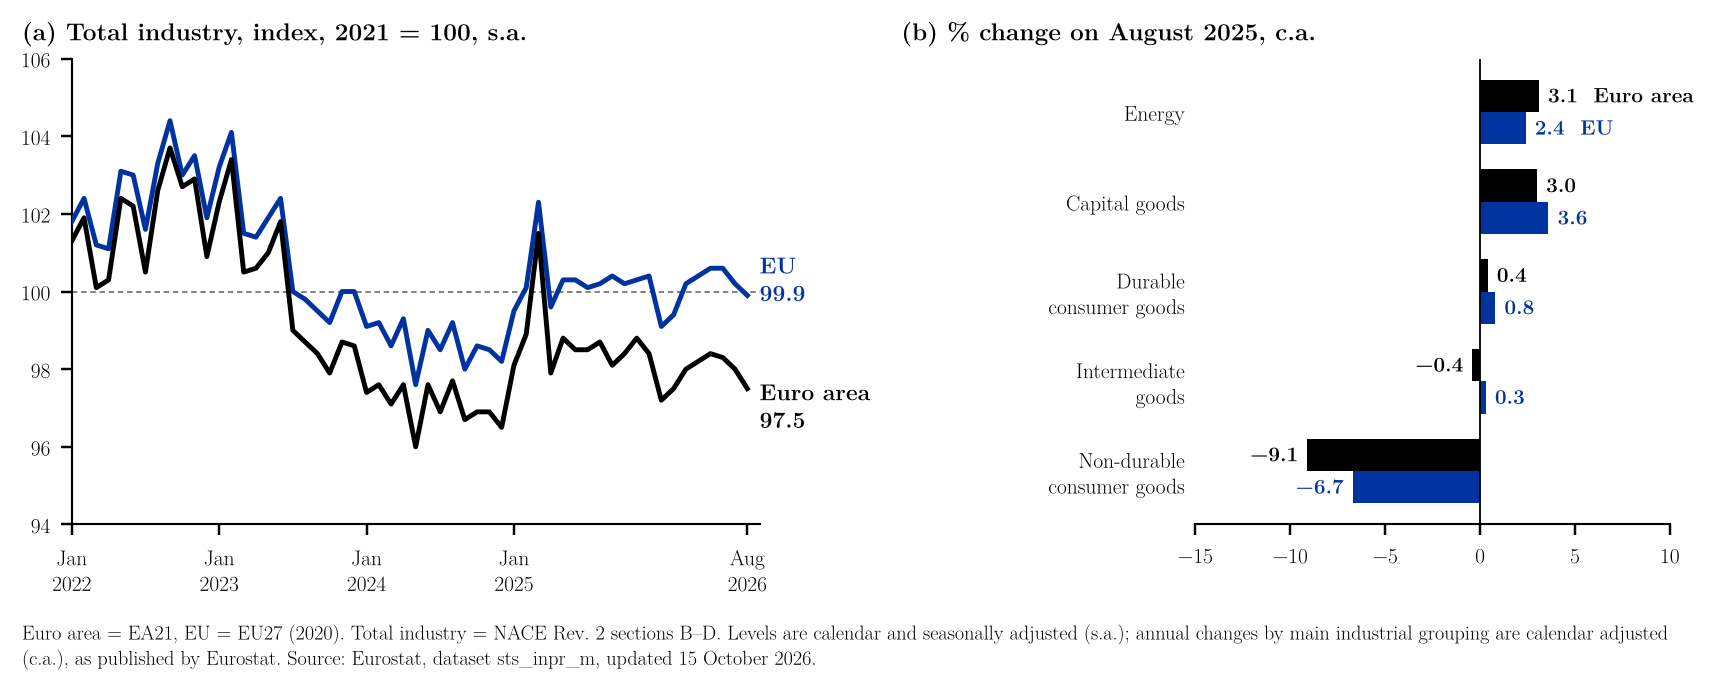
Eurostat reported on 15 October 2026 that seasonally and calendar adjusted industrial production fell 0.5% in the euro area and 0.3% in the EU in August, after declines of 0.3% and 0.4% in July; the euro area July figure was revised down from −0.1% (Eurostat, 2026a).1 Compared with August 2025, calendar adjusted output was 1.1% lower in the euro area and 0.2% lower in the EU (Eurostat, 2026a). August was the third consecutive monthly fall in the euro area, leaving its index at 97.5 (2021=100), the same as in February and the lowest since January 2026 (97.2); the EU index stood at 99.9 (Eurostat, 2026b; note 3). Comparing the three months to August with the previous three months smooths single-month noise: output was 0.3% lower in the euro area and 0.2% lower in the EU (Eurostat, 2026b; note 3). By main industrial grouping, non-durable consumer goods were 9.1% below a year earlier in the euro area and intermediate goods 0.4% below, while capital goods (3.0%) and energy (3.1%) were higher (Eurostat, 2026a, 2026b). Among member states, the largest monthly falls were in Belgium (−5.1%), Ireland (−3.1%) and Portugal (−2.0%); Ireland's annual rate has ranged from −22.1% to +0.5% over the six months shown in the release (Eurostat, 2026a, 2026b). Figure 1 uses the seasonally adjusted index for levels and calendar adjusted rates for annual changes: the calendar adjusted euro area index falls from 99.4 in July to 82.9 in August, an August drop that recurs in every year since 2019 and that only the seasonal adjustment removes (Eurostat, 2026b; note 3).23
References
Eurostat. (2026a, October 15). Industrial production down by 0.5% in the euro area and by 0.3% in the EU (Euro indicators). https://ec.europa.eu/eurostat/web/products-euro-indicators/w/4-15102026-ap
Eurostat. (2026b). Production in industry – monthly data (sts_inpr_m) (data set). Downloaded October 15 and 19, 2026, from https://ec.europa.eu/eurostat/databrowser/view/sts_inpr_m/default/table
Notes
-
The monthly and annual rates for the euro area and the EU, the July revision and the member-state figures are from the Eurostat release of 15 October 2026 (Eurostat, 2026a). ↑
-
Eurostat database, dataset sts_inpr_m (NACE Rev. 2 sections B–D and main industrial groupings), euro area EA21 and EU27_2020, updated 15 October 2026, downloaded 15 October 2026 (Eurostat, 2026b): monthly data (CSV), groupings (CSV). Monthly and annual rates are Eurostat's published rates; the three-month comparison is computed from the one-decimal index as $\bar{I}_{\text{Jun–Aug}}/\bar{I}_{\text{Mar–May}}-1$. Euro area and EU seasonally adjusted series are aggregates of seasonally adjusted national data (indirect adjustment), and missing recent national observations are estimated, so the latest months are subject to revision. Further data used in the text, downloaded 19 October 2026: member states, August 2026 (CSV), Ireland, annual rates (CSV). The workbook lists every number in the note next to the formula that produces it and a check against the text, so that readers who wish to examine the calculations can follow and audit them in a spreadsheet without losing time and without running any code. The code that draws the figure and repeats the same calculations is available on request. ↑
-
Calculations. Monthly rate from the seasonally adjusted index, matching Eurostat's published $-0.5$: $$\left(\frac{97.5}{98.0} - 1\right)\times 100 = -0.51$$ "The same as in February and the lowest since January 2026" means that among the 2026 values of the euro area index only January ($97.2$) is lower than August ($97.5$) and only February equals it. The 3-month comparison is $\bar I_{\text{Jun–Aug}}/\bar I_{\text{Mar–May}} - 1$. Euro area: $$\frac{(98.3 + 98.0 + 97.5)/3}{(98.0 + 98.2 + 98.4)/3} - 1 = -0.27\%$$ EU: $$\frac{(100.6 + 100.2 + 99.9)/3}{(100.2 + 100.4 + 100.6)/3} - 1 = -0.17\%$$ The August drop in the calendar adjusted euro area index (July → August) is: 2019 $100.8 \to 84.4$, 2020 $94.7 \to 79.1$, 2021 $103.0 \to 83.8$, 2022 $101.9 \to 86.6$, 2023 $100.2 \to 83.3$, 2024 $98.1 \to 82.8$, 2025 $99.7 \to 83.8$, 2026 $99.4 \to 82.9$. ↑