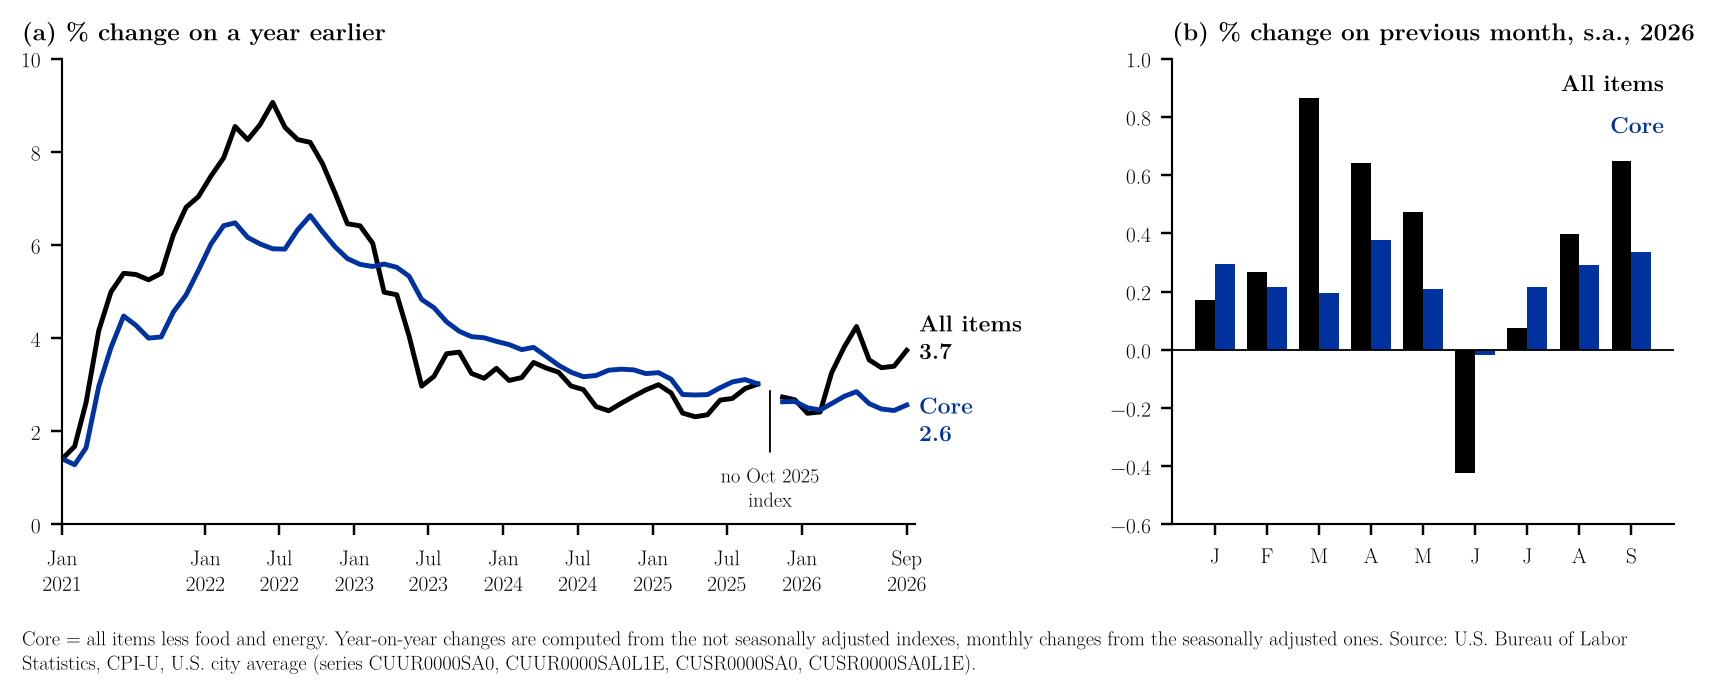
The U.S. Bureau of Labor Statistics (BLS) reported on 14 October 2026 that the consumer price index for all urban consumers rose 0.6% in September on a seasonally adjusted basis, after 0.4% in August, and 3.7% over the last twelve months, up from 3.4% (BLS, 2026a).1 The index excluding food and energy rose 0.3% in the month and 2.6% over the year, up from 2.4% (BLS, 2026a), leaving a gap of 1.1 percentage points between the headline and the core rate (note 3). Energy prices rose much faster than the rest of the index: the energy index increased 5.2% in September and 20.4% over twelve months, with gasoline up 9.1% in the month and 34.2% on a year earlier, and BLS notes that gasoline accounted for over half of the monthly all-items increase (BLS, 2026a). The food index was unchanged in September and 2.5% higher than a year earlier, and shelter rose 0.4% in the month and 3.2% over the year (BLS, 2026a). In Figure 1 the twelve-month headline rate is below its May 2026 level but above the 2.4% recorded in January and February, while the core rate has stayed between about 2.4% and 2.9% throughout 2026 (BLS, 2026b; note 3). The chart has no October 2025 observation because the BLS series has no index for that month (BLS, 2026b).23
References
U.S. Bureau of Labor Statistics. (2026a, October 14). Consumer price index – September 2026 (USDL-26-1574). https://www.bls.gov/news.release/archives/cpi_10142026.htm
U.S. Bureau of Labor Statistics. (2026b). Consumer price index for all urban consumers, series CUUR0000SA0, CUUR0000SA0L1E, CUSR0000SA0 and CUSR0000SA0L1E (data set). Downloaded October 14, 2026, from https://data.bls.gov/timeseries/CUUR0000SA0
Notes
-
The monthly and twelve-month changes in this paragraph for the all-items index, the index excluding food and energy, and the energy, gasoline, food and shelter indexes, and the statement on gasoline's share of the monthly increase, are from the text of the BLS release of 14 October 2026 (BLS, 2026a). The reference is to the archived copy of the release, whose address does not change. ↑
-
BLS Public Data API, series CUUR0000SA0 and CUUR0000SA0L1E (not seasonally adjusted, used for the twelve-month changes) and CUSR0000SA0 and CUSR0000SA0L1E (seasonally adjusted, used for the monthly changes), index 1982–84=100, January 2020 – September 2026, downloaded 14 October 2026 (BLS, 2026b): data (CSV). Rates in the chart are computed from the published indexes and can differ by 0.1 point from the rounded rates in the release. The workbook lists every number in the note next to the formula that produces it and a check against the text, so that readers who wish to examine the calculations can follow and audit them in a spreadsheet without losing time and without running any code. The code that draws the figure and repeats the same calculations is available on request. ↑
-
Calculations. With $P_t$ the index, the twelve-month change uses the not seasonally adjusted index and the monthly change the seasonally adjusted one: $$\pi^{12}_t = \left(\frac{P_t}{P_{t-12}} - 1\right)\times 100$$ $$\pi^{1}_t = \left(\frac{P^{sa}_t}{P^{sa}_{t-1}} - 1\right)\times 100$$ September 2026, all items and core: $$\left(\frac{336.940}{324.800} - 1\right)\times 100 = 3.74, \qquad \left(\frac{339.287}{330.804} - 1\right)\times 100 = 2.56$$ Monthly change: $$\left(\frac{336.298}{334.131} - 1\right)\times 100 = 0.65$$ The 1.1-point gap is the difference of the published, rounded rates ($3.7 - 2.6$). From the unrounded indexes: $$3.738 - 2.564 = 1.17$$ The 2026 range of the core rate is $\min_t \pi^{12}_t = 2.45$ (August) to $\max_t \pi^{12}_t = 2.85$ (May); the headline rate was 4.25 in May and 2.39 and 2.41 in January and February. ↑