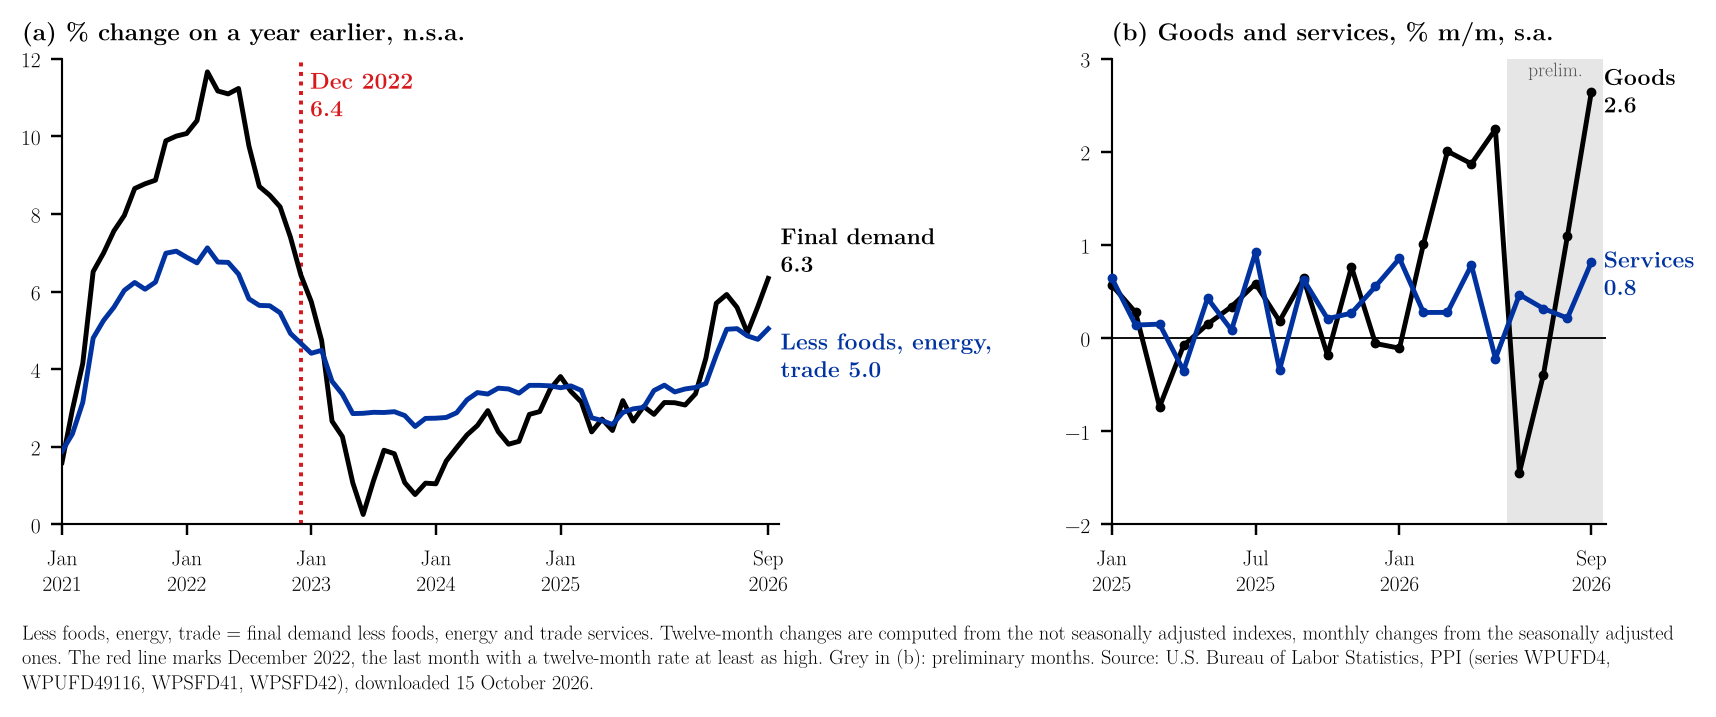
The U.S. Bureau of Labor Statistics (BLS) reported on 15 October 2026 that the producer price index for final demand rose 1.3% in September on a seasonally adjusted basis, after 0.5% in August and 0.2% in July, the largest monthly rise since March 2022 (1.7%) (BLS, 2026a, 2026b).1 Over twelve months the unadjusted index rose 6.3%, up from 5.6% in August and the highest rate since December 2022 (6.4%) (BLS, 2026a, 2026b). Goods prices rose 2.6%, the largest monthly increase since the index began in November 2009, with energy up 10.8% and gasoline up 20.3%; BLS attributes half of the goods increase to gasoline (BLS, 2026a, 2026b). Services rose 0.8% (BLS, 2026a). The index excluding foods, energy and trade services rose 0.5% in the month and 5.0% over the year (4.8% in August) (BLS, 2026a). The September acceleration in the twelve-month rate is not a base effect: in logs, the change in the twelve-month rate (0.7 point) equals the unadjusted monthly change in September 2026 (1.1%) minus the one in September 2025 that drops out of the window (0.4%) (BLS, 2026b; note 3). Annualised over three months, seasonally adjusted, final demand prices rose 8.1% and the index excluding foods, energy and trade 5.1% (BLS, 2026b; note 3). In Figure 1, the gap between the two twelve-month rates widened to 1.3 points (BLS, 2026b; note 3).23
References
U.S. Bureau of Labor Statistics. (2026a, October 15). Producer price indexes – September 2026 (USDL-26-1576). https://www.bls.gov/news.release/archives/ppi_10152026.htm
U.S. Bureau of Labor Statistics. (2026b). Producer price index for final demand, series WPSFD4, WPSFD49116, WPSFD41, WPSFD42, WPUFD4 and WPUFD49116 (data set). Downloaded October 15 and 19, 2026, from https://data.bls.gov/timeseries/WPSFD4
Notes
-
The monthly changes of final demand, goods and services, the twelve-month rates of the two indexes, the energy and gasoline changes and the share of the goods increase due to gasoline are from the BLS release of 15 October 2026 (BLS, 2026a). The reference is to the archived copy of the release, whose address does not change. ↑
-
BLS Public Data API, series WPSFD4, WPSFD49116, WPSFD41 and WPSFD42 (seasonally adjusted, used for monthly and three-month annualised changes) and WPUFD4 and WPUFD49116 (not seasonally adjusted, used for twelve-month changes), January 2019 – September 2026, downloaded 15 October 2026 (BLS, 2026b): data (CSV). Rates are computed from the published indexes; rounded to one decimal they match Table A in each month checked (July–September 2026 and September 2025). The three-month annualised rate is $(P_t/P_{t-3})^4-1$; the base-effect identity is $\Delta\ln(P_t/P_{t-12}) = \ln(P_t/P_{t-1}) - \ln(P_{t-12}/P_{t-13})$ on unadjusted indexes. BLS adjusts the final demand aggregates indirectly, by aggregating seasonally adjusted components, and revises seasonal factors each January for the previous five years; the API flags June–September 2026 as preliminary. Further data used in the text, downloaded 19 October 2026: final demand goods since November 2009 (CSV). The workbook lists every number in the note next to the formula that produces it and a check against the text, so that readers who wish to examine the calculations can follow and audit them in a spreadsheet without losing time and without running any code. The code that draws the figure and repeats the same calculations is available on request. ↑
-
Calculations. Monthly change $(P^{sa}_t/P^{sa}_{t-1} - 1)\times 100$ and twelve-month change $(P_t/P_{t-12} - 1)\times 100$ on the not seasonally adjusted index. September 2026, final demand, monthly and twelve-month: $$\left(\frac{159.780}{157.662} - 1\right)\times 100 = 1.34, \qquad \left(\frac{159.613}{150.100} - 1\right)\times 100 = 6.34$$ Less foods, energy and trade, twelve-month: $$\left(\frac{143.929}{137.021} - 1\right)\times 100 = 5.04$$ "Largest since March 2022" means the last earlier month $s$ with $\pi^{1}_s \ge 1.34$ is March 2022 ($1.68$); "highest since December 2022" means the last earlier month with $\pi^{12}_s \ge 6.34$ is December 2022 ($6.42$). Gap between the two twelve-month rates, September and August: $$6.338 - 5.042 = 1.296, \qquad 5.613 - 4.768 = 0.845$$ Goods, seasonally adjusted: $$\left(\frac{162.341}{158.157} - 1\right)\times 100 = 2.65$$ This is the largest of the 202 monthly changes since the first one in December 2009 (the index starts in November 2009); the previous largest was $2.49$, in March 2022. ↑