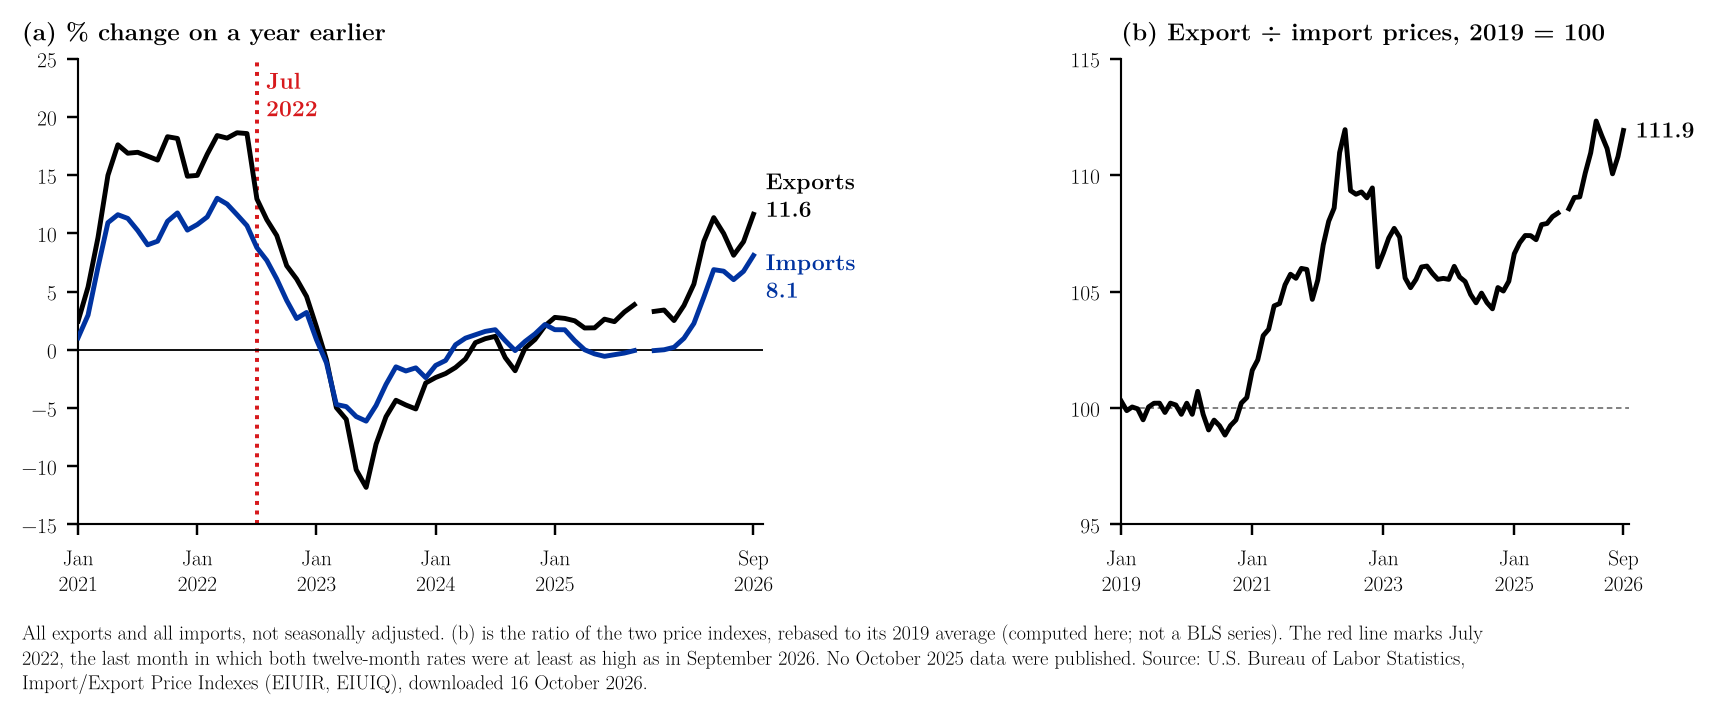
The U.S. Bureau of Labor Statistics (BLS) reported on 16 October 2026 that import prices rose 1.1% in September, after 0.5% in August, and export prices rose 2.2%, after 1.2% (BLS, 2026a).1 Over twelve months import prices rose 8.1%, the largest increase since July 2022 (8.8%), and export prices 11.6%, the largest since July 2022 (12.9%) (BLS, 2026a, 2026b; note 3). Fuel import prices rose 4.8% in the month and 34.5% on the year; nonfuel import prices rose 0.7% and 6.0%, the highest twelve-month rate since April 2022 (7.2%), and BLS notes that they have not fallen in any month since August 2025 (BLS, 2026a). Agricultural export prices rose 2.6%, the largest monthly increase since November 2022, led by soybeans, corn and wheat; nonagricultural export prices rose 2.1% (BLS, 2026a). Export prices have risen faster than import prices: the ratio of the two indexes was 3.3% higher than a year earlier and 11.9% above its 2019 average (Figure 1b), just below its April 2026 level (112.3), the highest since 2019 in this series, and its June 2022 level (111.95) (BLS, 2026b; note 3). This ratio is a rough measure of the terms of trade; it is computed here from the two aggregate indexes and is not a BLS series. The indexes are not seasonally adjusted, so the monthly changes include seasonal movements, and some October and November 2025 values were not published because of the 2025 lapse in appropriations (BLS, 2026a). The formulas and numbers behind each rate are in note 3.23
References
U.S. Bureau of Labor Statistics. (2026a, October 16). U.S. import and export price indexes – September 2026 (USDL-26-1577). https://www.bls.gov/news.release/archives/ximpim_10162026.htm
U.S. Bureau of Labor Statistics. (2026b). Import and export price indexes, series EIUIR, EIUIQ, EIUIR10, EIUIREXFUELS, EIUIQAG and EIUIQEXAG (data set). Downloaded October 16, 2026, from https://data.bls.gov/timeseries/EIUIR
Notes
-
The monthly and twelve-month changes of the import and export indexes, the comparisons with earlier months for fuel, nonfuel and agricultural prices and the reasons given for the changes are from the text of the BLS release of 16 October 2026 (BLS, 2026a). The reference is to the archived copy of the release, whose address does not change. ↑
-
BLS Public Data API, series EIUIR (all imports), EIUIQ (all exports), EIUIR10 (fuel imports), EIUIREXFUELS (nonfuel imports), EIUIQAG (agricultural exports) and EIUIQEXAG (nonagricultural exports), 2000 = 100, not seasonally adjusted, January 2019 – September 2026, downloaded 16 October 2026 (BLS, 2026b): data (CSV). Rates are computed from the published indexes; rounded to one decimal they match Table A of the release for September 2026 and for the twelve months to September 2025 and 2026. The workbook lists every number in the note next to the formula that produces it and a check against the text, so that readers who wish to examine the calculations can follow and audit them in a spreadsheet without losing time and without running any code. The code that draws the figure and repeats the same calculations is available on request. ↑
-
Calculations. $P_t$ is a price index in month $t$. Monthly and twelve-month changes: $$\pi^{1}_t = \left(\frac{P_t}{P_{t-1}} - 1\right)\times 100$$ $$\pi^{12}_t = \left(\frac{P_t}{P_{t-12}} - 1\right)\times 100$$ September 2026, all imports: $$\pi^{1} = \left(\frac{152.2}{150.5} - 1\right)\times 100 = 1.13, \qquad \pi^{12} = \left(\frac{152.2}{140.8} - 1\right)\times 100 = 8.10$$ All exports: $$\pi^{1} = \left(\frac{170.8}{167.2} - 1\right)\times 100 = 2.15, \qquad \pi^{12} = \left(\frac{170.8}{153.0} - 1\right)\times 100 = 11.63$$ "Largest since July 2022": in every month from August 2022 to August 2026, $\pi^{12}_s < 8.10$ for imports and $\pi^{12}_s < 11.63$ for exports; in July 2022 the rates were $8.77$ and $12.95$. The ratio in Figure 1b, with $X_t$ and $M_t$ the export and import indexes: $$R_t = \frac{X_t/M_t}{\overline{(X/M)}_{2019}}\times 100$$ where $\overline{(X/M)}_{2019} = 1.00273$ is the average of the twelve monthly ratios in 2019. September 2026: $$\frac{X}{M} = \frac{170.8}{152.2} = 1.12221, \qquad R = \frac{1.12221}{1.00273}\times 100 = 111.915$$ September 2025: $$\frac{X}{M} = \frac{153.0}{140.8} = 1.08665, \qquad R = \frac{1.08665}{1.00273}\times 100 = 108.369$$ Change on a year earlier: $$\left(\frac{111.915}{108.369} - 1\right)\times 100 = 3.27$$ The twelve-month changes give the same result: $$\left(\frac{1.11634}{1.08097} - 1\right)\times 100 = 3.27$$ ↑