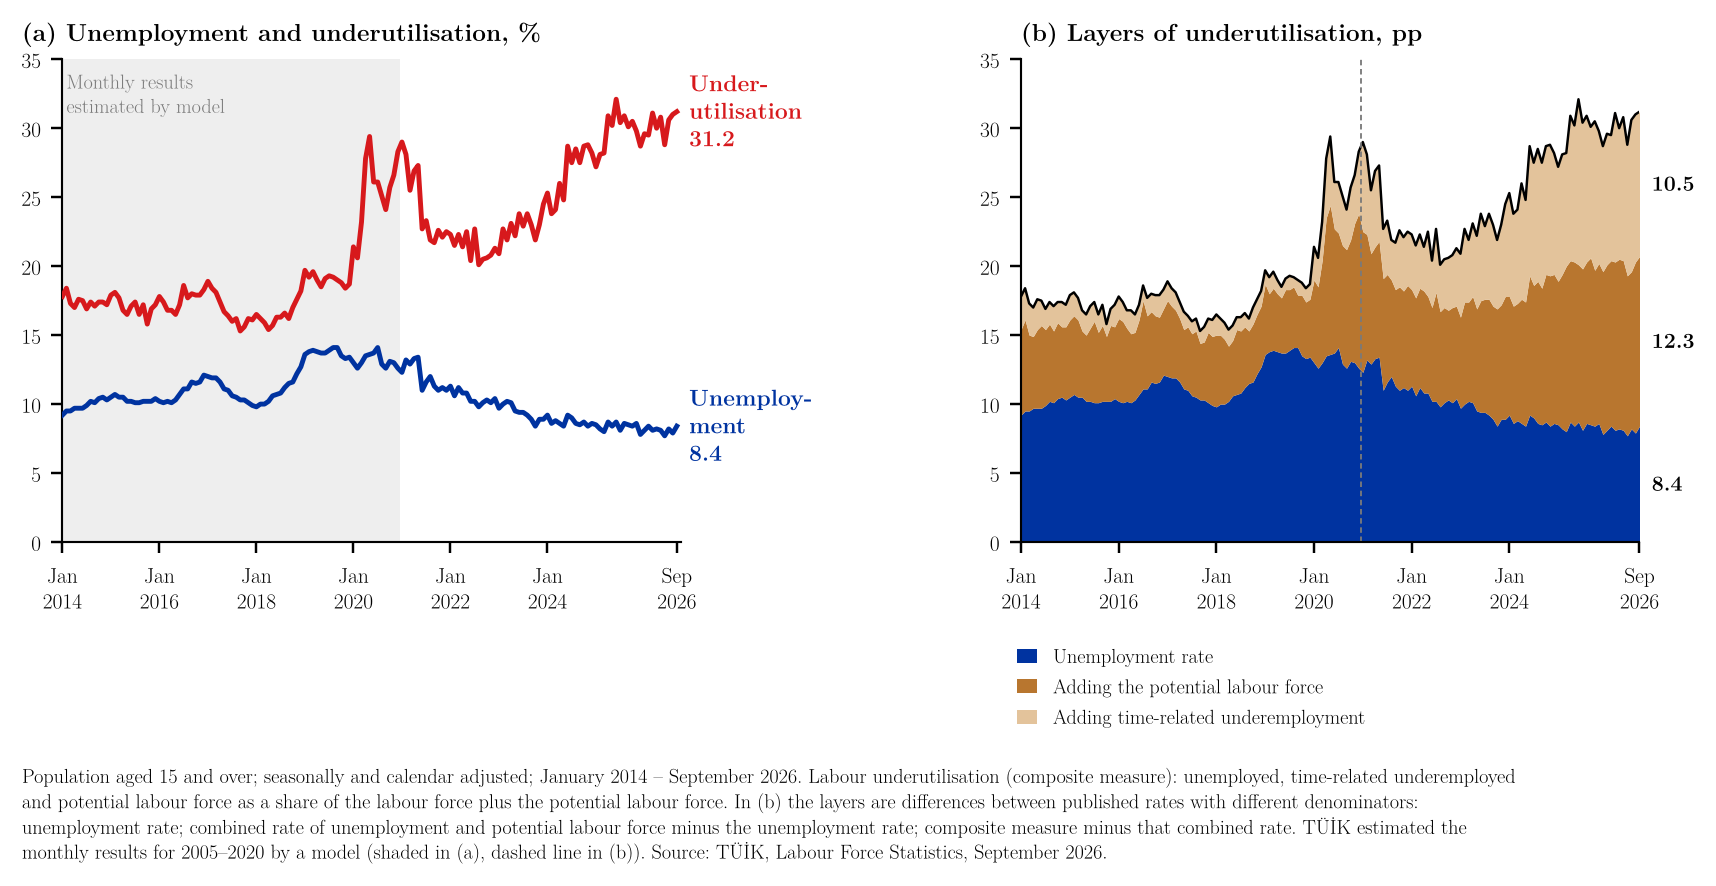
The Turkish Statistical Institute (TÜİK) reported on 27 October that the seasonally adjusted unemployment rate rose by 0.5 points to 8.4% in September 2026, as the number of unemployed increased by 198 thousand to 2.967 million (TÜİK, 2026a).1 Employment fell by 49 thousand to 32.445 million, the employment rate eased to 48.3% and the labour force participation rate rose to 52.7%. Measured against the monthly series that begins in January 2014, the unemployment rate is low: it was 8.4% or lower in only 18 of 153 months (11.8%), its average is 10.6%, and it has ranged from 7.7% (June 2026) to 14.1% (August and September 2019, July 2020). It averaged 11.1% in 2014–2019 and 9.1% from January 2022 to September 2026.
The unemployment rate counts only people without work who are looking for it and available to start; the composite measure of labour underutilisation also counts employed people who work fewer hours than they would like and are available to work more (time-related underemployment), and people outside the labour force who want work but are either not searching or not available (the potential labour force). In September 2026 that measure rose by 0.2 points to 31.2%, the second-highest value in the series after June 2025 (32.1%); it has been 30% or higher in 13 months, all of them since April 2025. The two rates have moved in opposite directions: from January 2022 to September 2026 unemployment fell from 11.3% to 8.4% while underutilisation rose from 22.3% to 31.2%. The gap between them widened from 8.6 points in January 2014 to 22.8 points, and underutilisation is now 3.7 times the unemployment rate, against 1.9 times in January 2014. Splitting the gap with TÜİK's two intermediate rates, adding the potential labour force accounts for 12.3 points in September 2026 (6.2 in January 2014), and adding time-related underemployment for 10.5 points (2.4) (Figure 1b). The measure is higher for women, 40.4%, than for men, 25.6%; the unemployment rates are 11.3% and 6.9%. TÜİK estimated the monthly figures for 2014–2020 by a model. This note describes the published rates; it does not test why underutilisation has risen while unemployment has fallen (TÜİK, 2026a, 2026b).23
References
Turkish Statistical Institute. (2026a, October 27). İşgücü istatistikleri, Eylül 2026 (in Turkish; English title: Labour force statistics, September 2026; Bulletin No. 57988). https://veriportali.tuik.gov.tr/tr/press/57988
Turkish Statistical Institute. (2026b). Mevsim ve takvim etkilerinden arındırılmış işgücüne ilişkin tamamlayıcı göstergeler, 2014-2026 (in Turkish; English title: Seasonally and calendar adjusted supplementary indicators for labour force, 2014–2026) (data set). Downloaded October 31, 2026, from https://veriportali.tuik.gov.tr/tr/press/57988
Notes
-
The bulletin (TÜİK, 2026a), text and table "Mevsim etkisinden arındırılmış temel işgücü göstergeleri, 15+ yaş, Eylül 2026". Employment, the employment and participation rates and the number of unemployed are quoted from the bulletin. The next bulletin is scheduled for 30 November 2026. ↑
-
TÜİK (2026a), table "Mevsim ve takvim etkilerinden arındırılmış işgücüne ilişkin tamamlayıcı göstergeler, 2014-2026" (seasonally and calendar adjusted supplementary indicators for labour force), 15+, total, men and women, January 2014 – September 2026, downloaded 31 October 2026: data (CSV). In TÜİK's definition the composite measure is the number of unemployed, time-related underemployed and potential labour force divided by the labour force plus the potential labour force; the table notes that the monthly results for 2005–2020 were estimated by a model. The workbook lists every number in the note next to the formula that produces it and a check against the text, so that readers who wish to examine the calculations can follow and audit them in a spreadsheet without losing time and without running any code. The code that draws the figure and repeats the same calculations is available on request. ↑
-
Calculations (author's). $U_t$ is the unemployment rate, $R^{(2)}_t$ the combined rate of unemployment and potential labour force and $R^{(3)}_t$ the composite measure, all as published, January 2014 – September 2026 ($T = 153$). Mean, and share of months with $U_t \le 8.4$: $$\bar U = \frac{1}{T}\sum_t U_t = 10.58, \qquad \frac{18}{153} = 11.8\%$$ Gap $R^{(3)}_t - U_t$, September 2026 and January 2014: $$31.2 - 8.4 = 22.8, \qquad 17.8 - 9.2 = 8.6$$ Ratio, September 2026 and January 2014: $$\frac{31.2}{8.4} = 3.71, \qquad \frac{17.8}{9.2} = 1.93$$ The first part of the gap is $R^{(2)}_t - U_t$: $$20.7 - 8.4 = 12.3, \qquad 15.4 - 9.2 = 6.2$$ The second part is $R^{(3)}_t - R^{(2)}_t$: $$31.2 - 20.7 = 10.5, \qquad 17.8 - 15.4 = 2.4$$ Because $U_t$ is a share of the labour force while $R^{(2)}_t$ and $R^{(3)}_t$ are shares of the labour force plus the potential labour force, the parts are differences between published rates, not exact shares of each group. Period averages are simple means of the monthly rates: 2014–2019, 72 months; January 2022 – September 2026, 57 months. ↑