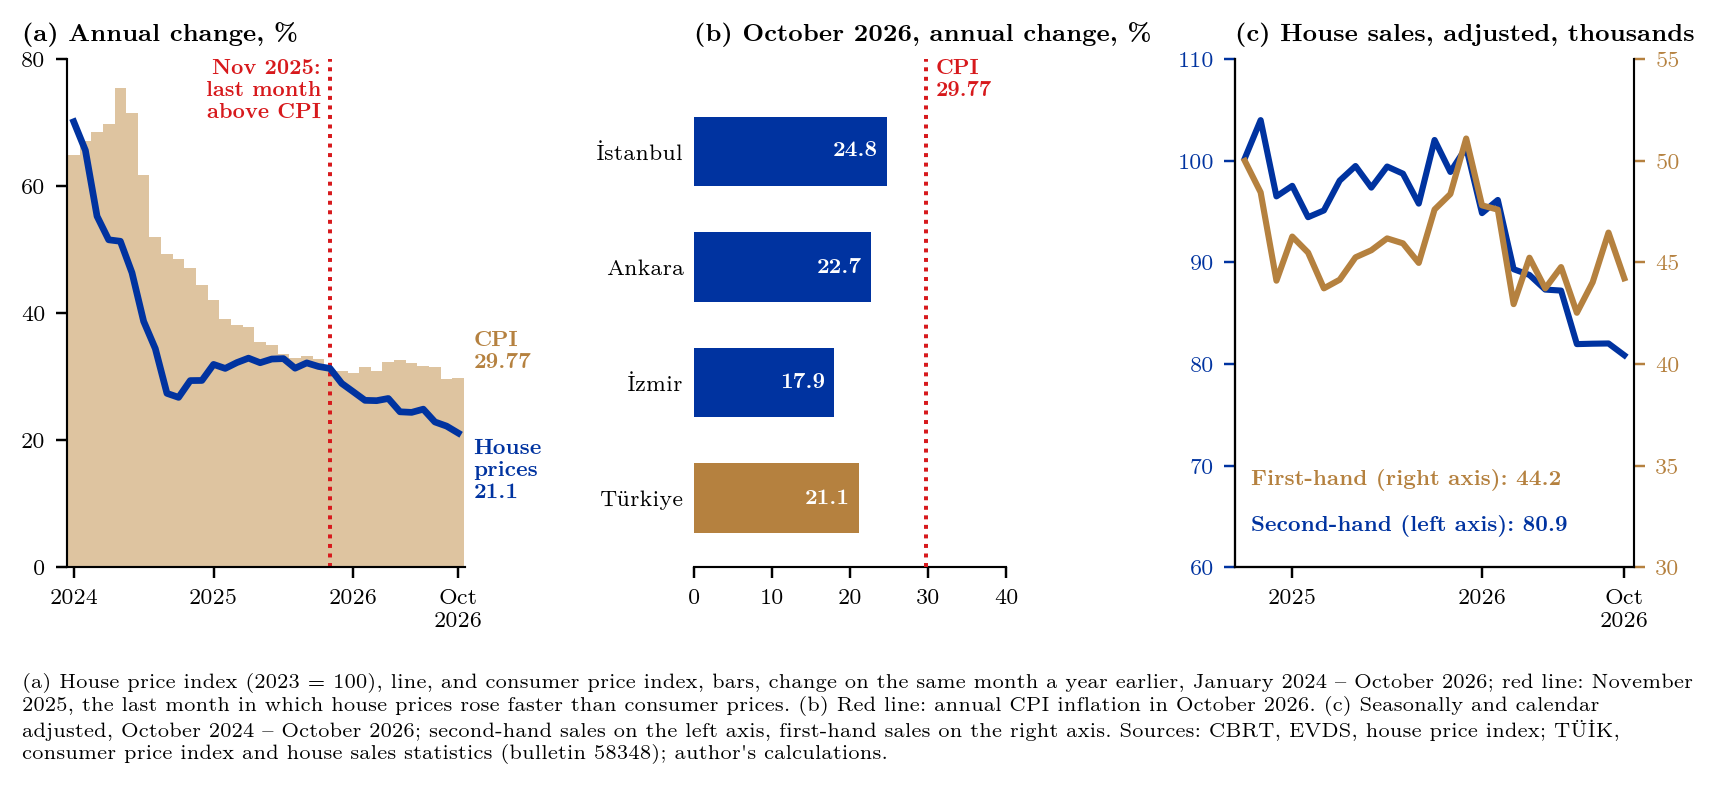
The CBRT's house price index rose 0.7% in October 2026 and 21.1% on a year earlier, to 240.9 (2023 = 100) (CBRT, 2026a, 2026b).1 The annual increase is the lowest since May 2020. With consumer prices 29.77% higher (Turkish Statistical Institute, 2026a), house prices fell 6.6% in real terms, and they have now risen more slowly than consumer prices for eleven months in a row (Figure 1a). The September index was revised to 239.2 from 239.4, which lowers September's annual increase to 22.2% from the 22.3% in the previous note (Yılmaz, 2026a). Prices rose 24.8% in İstanbul, 22.7% in Ankara and 17.9% in İzmir, where they fell 0.6% on the month (Figure 1b). The smallest regional increase, 13.0%, was in Edirne, Kırklareli and Tekirdağ. Rents paid by new tenants rose 24.5% on a year earlier, a real fall of 4.1%.
TÜİK reported 131,072 house sales in October, 23.3% fewer than a year earlier (Turkish Statistical Institute, 2026b).2 Second-hand sales fell 28.5% to 80,967 and first-hand sales 13.1% to 50,105. Mortgaged sales fell 5.7% to 23,286 while other sales fell 26.3%, so the mortgaged share rose to 17.8% from 14.4%. Over January–October total sales were 9.2% lower and mortgaged sales 20.8% higher. In September the fall was 9.3% (Yılmaz, 2026b). The seasonally and calendar adjusted series point the same way: second-hand sales fell 1.4% on the month to 80,871, the lowest of the 25 months in the bulletin and 20.8% below October 2025, and first-hand sales fell 4.8% (Figure 1c). These series are re-estimated each month; September's adjusted second-hand figure is now 82,032, against 84,321 in the previous bulletin. Sales to foreigners rose 0.9% to 2,259.
References
Central Bank of the Republic of Türkiye. (2026a, November 17). Konut fiyat endeksi ve yeni kiracı kira endeksi, Ekim 2026 (in Turkish; English title: House price index and new tenant rent index, October 2026). https://www.tcmb.gov.tr/wps/wcm/connect/TR/TCMB+TR/Main+Menu/Istatistikler/Reel+Sektor+Istatistikleri/Konut+Fiyat+Endeksi
Central Bank of the Republic of Türkiye. (2026b). Electronic Data Delivery System (EVDS) (data set): series TP.KFE.TR, TP.KFE.TR10, TP.KFE.TR51 and TP.KFE.TR31. Retrieved November 18, 2026, from https://evds3.tcmb.gov.tr
Turkish Statistical Institute. (2026a, November 3). Tüketici fiyat endeksi, Ekim 2026 (in Turkish; English title: Consumer price index, October 2026) (Press release No. 58291). https://veriportali.tuik.gov.tr/tr/press/58291
Turkish Statistical Institute. (2026b, November 17). Konut ve iş yeri satış istatistikleri, Ekim 2026 (in Turkish; English title: House and workplace sales statistics, October 2026) (Press release No. 58348). https://veriportali.tuik.gov.tr/tr/press/58348
Yılmaz, M. İ. (2026a, October 16). Konut fiyat endeksi, Eylül 2026: yıllık artış %22,3 ile Mayıs 2020'den bu yana en düşük (in Turkish). https://muhammedikbalyilmaz.com/posts/konut-fiyat-endeksi-eylul-2026.html
Yılmaz, M. İ. (2026b, October 16). Konut satışları, Eylül 2026: toplam satış %9,3 azaldı, ipotekli satış %5,1 arttı (in Turkish). https://muhammedikbalyilmaz.com/posts/konut-satislari-eylul-2026.html
Notes
-
Index values and the annual rates are from EVDS (CBRT, 2026b), retrieved 18 November 2026; the monthly and annual rates computed from the index equal those in the release. The real change, the city and regional rates and the rent index are from the release (CBRT, 2026a). Data: house price index, January 2019 – October 2026 (CSV); consumer prices: CPI (CSV). "Lowest since May 2020" means that the annual rate was above 21.15% in every month from June 2020 to September 2026; it was 16.93% in May 2020. Real change: $\left(\frac{1.2115}{1.2977} - 1\right)\times 100 = -6.64$. House prices last rose faster than consumer prices in November 2025 (31.32% against 31.07%). ↑
-
Sales counts and rates are from the bulletin (Turkish Statistical Institute, 2026b), and the monthly series are the data of its charts: house sales, October 2024 – October 2026 (CSV). The unadjusted counts for October 2024 – September 2026 are the same as in the previous bulletin. Mortgaged share: $23{,}286 / 131{,}072 \times 100 = 17.77$ and $24{,}684 / 170{,}955 \times 100 = 14.44$. Adjusted second-hand sales against October 2025: $\left(\frac{80{,}871}{102{,}051} - 1\right)\times 100 = -20.75$. The workbook lists every number in the note next to the formula that produces it and a check against the text, so that readers who wish to examine the calculations can follow and audit them in a spreadsheet without losing time and without running any code. The code that draws the figure and repeats the same calculations is available on request. ↑