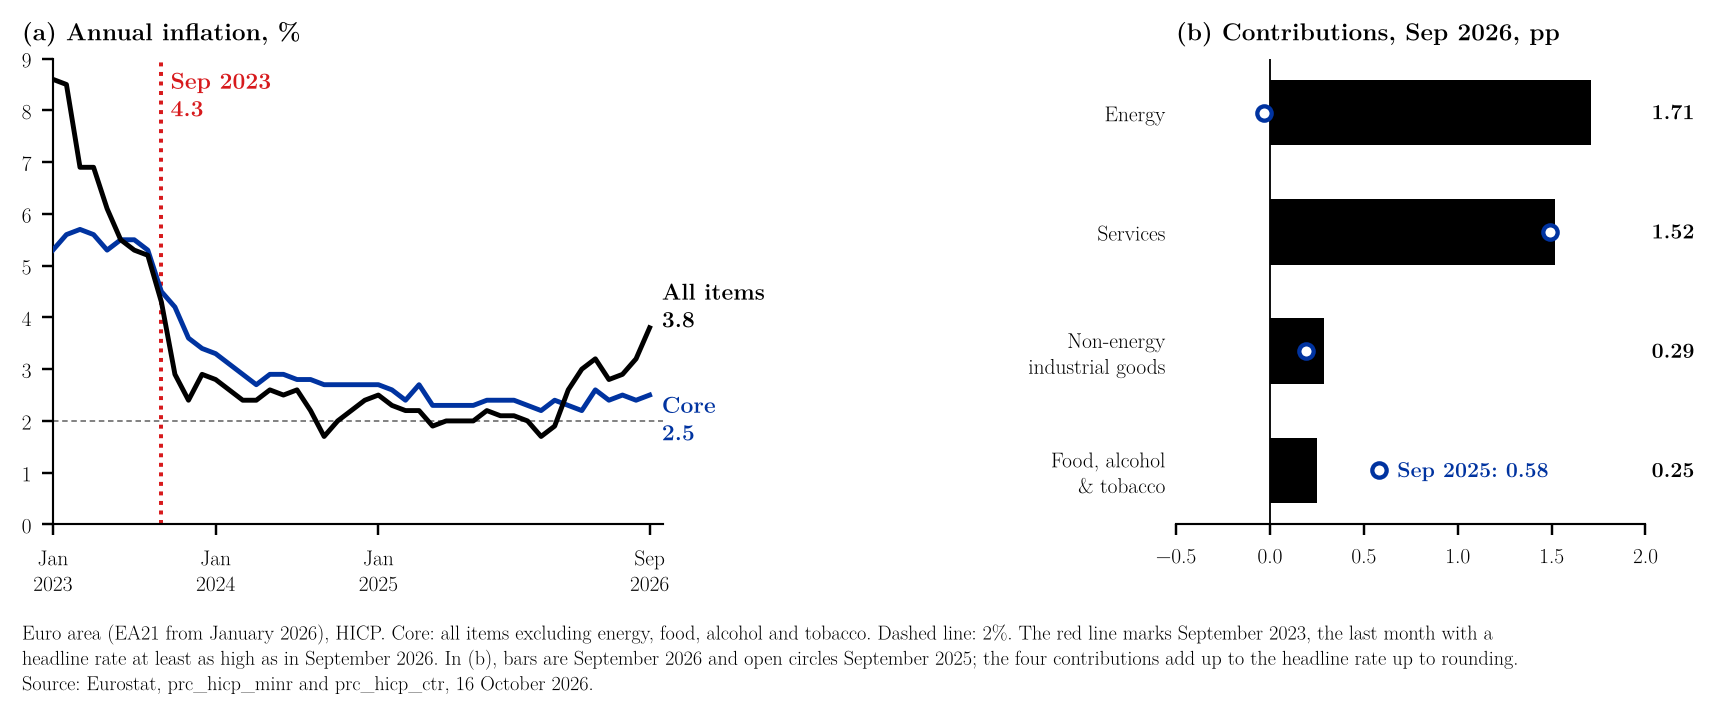
Eurostat confirmed on 16 October 2026 that euro area annual inflation, measured by the HICP, was 3.8% in September, up from 3.2% in August and 2.2% a year earlier; the flash estimate of 2 October was also 3.8% (Eurostat, 2026a).1 This is the highest rate since September 2023 (4.3%), and almost half of it comes from energy: energy prices rose 18.9% on the year, the highest rate since January 2023 (also 18.9%), and contributed 1.71 points, against −0.03 a year earlier (Eurostat, 2026b, 2026c; Figure 1b; note 3). Energy has a weight of 9.0% in the index (Eurostat, 2026d). Services contributed 1.52 points (annual rate 3.2%), non-energy industrial goods 0.29 (1.1%) and food, alcohol and tobacco 0.25 (1.3%) (Eurostat, 2026b, 2026c). Inflation excluding energy, food, alcohol and tobacco was 2.5%, after 2.4% in August, and has stayed between 2.2% and 2.6% throughout 2026, so the 1.3-point gap between the headline and core rates is mostly energy (Eurostat, 2026b; Figure 1a; note 3). Compared with September 2025 the headline rate is 1.6 points higher; in contributions, energy added 1.74 points, non-energy industrial goods 0.10 and services 0.03, while food, alcohol and tobacco subtracted 0.33 (Eurostat, 2026c; note 3). EU inflation was also 3.8%; among member states the highest rates were in Romania (6.5%), Lithuania (6.1%) and Bulgaria (5.6%), and the lowest in Sweden (1.0%), Hungary and Denmark (both 2.1%) (Eurostat, 2026a, 2026b). Note 3 shows the arithmetic.23
References
Eurostat. (2026a, October 16). Annual inflation up to 3.8% in the euro area (Euro indicators). https://ec.europa.eu/eurostat/web/products-euro-indicators/w/2-16102026-ap
Eurostat. (2026b). Harmonised index of consumer prices (HICP) – ECOICOP ver. 2 – indices and rates of change, monthly data (prc_hicp_minr) (data set). Downloaded October 16 and 19, 2026, from https://ec.europa.eu/eurostat/databrowser/view/prc_hicp_minr/default/table
Eurostat. (2026c). Harmonised index of consumer prices (HICP) – ECOICOP ver. 2 – contributions to euro area annual inflation (prc_hicp_ctr) (data set). Downloaded October 16, 2026, from https://ec.europa.eu/eurostat/databrowser/view/prc_hicp_ctr/default/table
Eurostat. (2026d). Harmonised index of consumer prices (HICP) – ECOICOP ver. 2 – item weights (prc_hicp_iw) (data set). Downloaded October 16, 2026, from https://ec.europa.eu/eurostat/databrowser/view/prc_hicp_iw/default/table
Notes
-
The September rate, the August and September 2025 rates, the EU rate and the flash estimate are from the Eurostat release of 16 October 2026 (Eurostat, 2026a). Contributions and item weights are from the release tables, that is, from the datasets prc_hicp_ctr and prc_hicp_iw (Eurostat, 2026c, 2026d). ↑
-
Eurostat database, dataset prc_hicp_minr (annual rate of change, euro area with evolving composition: EA20 up to December 2025, EA21 including Bulgaria from January 2026), all items, all items excluding energy, food, alcohol and tobacco, energy, services, food, alcohol and tobacco, and non-energy industrial goods, January 2019 – September 2026, downloaded 16 October 2026 (Eurostat, 2026b): data (CSV) and contributions (CSV). The rates are Eurostat's published one-decimal rates; "highest since" comparisons use these rounded rates. Further data used in the text, downloaded 19 October 2026: member states, September 2026 (CSV). The workbook lists every number in the note next to the formula that produces it and a check against the text, so that readers who wish to examine the calculations can follow and audit them in a spreadsheet without losing time and without running any code. The code that draws the figure and repeats the same calculations is available on request. ↑
-
Calculations. Contributions add up to the headline rate up to rounding. September 2026: $$1.71 + 1.52 + 0.29 + 0.25 = 3.77 \approx 3.8$$ September 2025: $$-0.03 + 1.49 + 0.19 + 0.58 = 2.23 \approx 2.2$$ The change in the headline rate over the year splits into the changes in contributions. Energy and services: $$1.71 - (-0.03) = 1.74, \qquad 1.52 - 1.49 = 0.03$$ Non-energy industrial goods, and food, alcohol and tobacco: $$0.29 - 0.19 = 0.10, \qquad 0.25 - 0.58 = -0.33$$ The total is $1.54$, against $3.8 - 2.2 = 1.6$ in rounded headline rates. Energy's share of the headline rate: $$\frac{1.71}{3.77} = 0.45$$ A contribution is roughly the component's weight times its annual rate, $c_i \approx w_i\,\pi_i$: $$c_{\text{energy}} \approx 0.0903 \times 18.9 = 1.71$$ For services the approximation is close to the published $1.52$: $$0.4682 \times 3.2 = 1.50$$ Eurostat computes contributions with a method that keeps them additive, which is not exactly this product, so the published contributions are used throughout. Gap between headline and core, in points: $$3.8 - 2.5 = 1.3$$ "Highest since September 2023": every monthly headline rate from October 2023 to August 2026 is at most $3.2$, below $3.8$; September 2023 was $4.3$. Energy: every monthly rate from February 2023 to August 2026 is below $18.9$. ↑