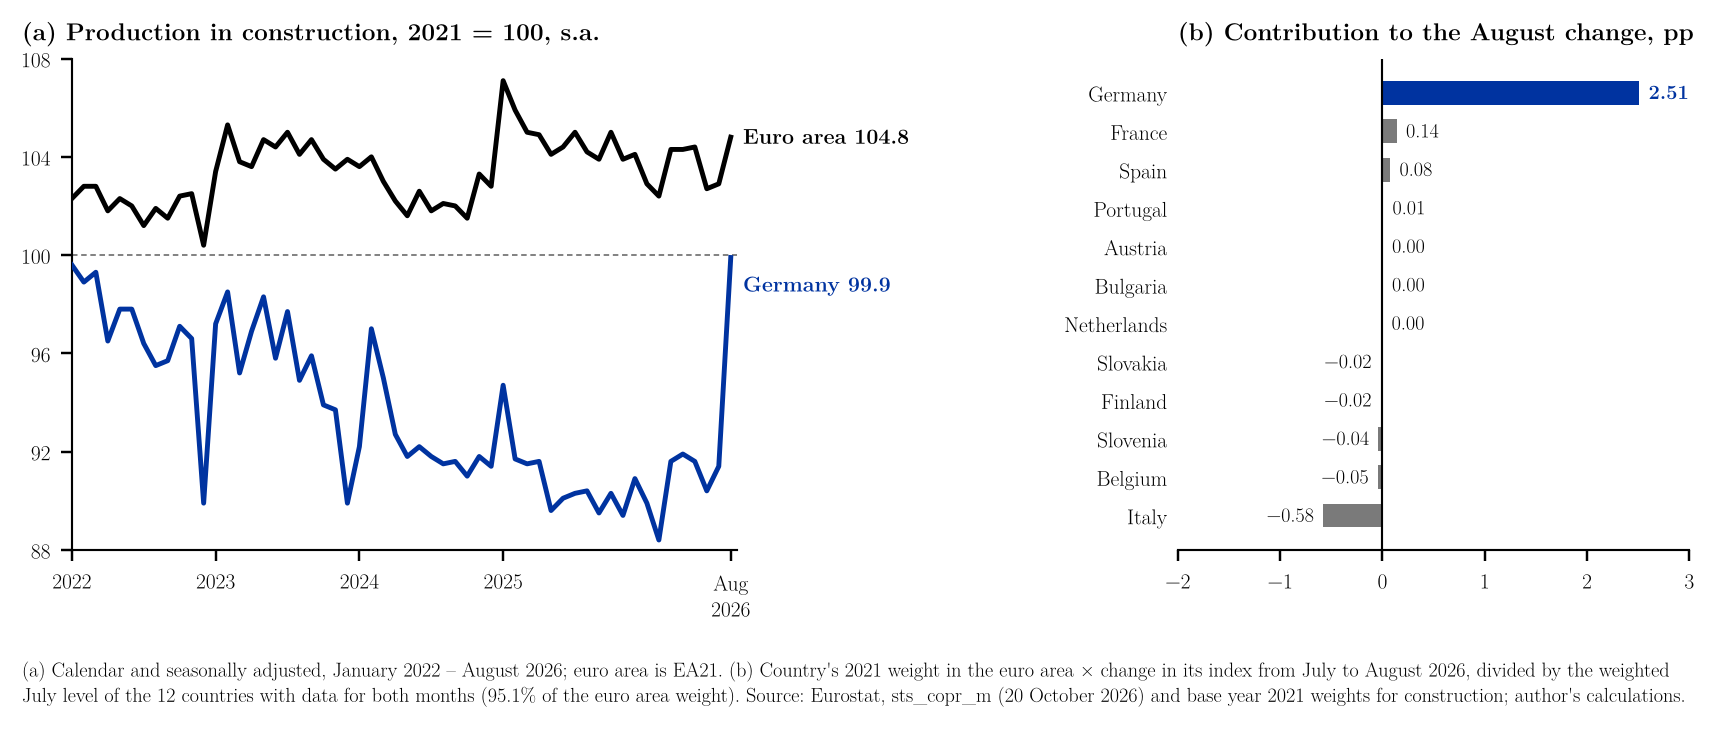
Eurostat reported on 20 October 2026 that seasonally and calendar adjusted production in construction rose by 1.8% in the euro area and by 2.0% in the EU in August, after +0.2% and −0.1% in July; compared with August 2025, calendar adjusted output was 1.4% higher in the euro area and 2.6% higher in the EU (Eurostat, 2026a).1 By sector, the euro area increase came from specialised construction activities (+2.5%), while construction of buildings fell by 0.4% and civil engineering by 2.1%. The increase is a German one: output in Germany, which carries 28.7% of the euro area weight, rose by 9.3% on the month, taking its index from 91.4 to 99.9 (2021=100), the highest level since November 2021 (Figure 1a). Weighting each country's change by Eurostat's 2021 country weights, Germany added about 2.5 percentage points to the euro area change, while the other eleven member states with August data together took off about 0.5 points, Italy (−2.9%) alone 0.6 (Figure 1b). Taken together, output in those eleven countries fell by 0.6% in August. These are first estimates, and figures for several smaller member states are missing, so the decomposition is approximate and subject to revision; note 3 shows that a second way of computing it gives the same picture (Eurostat, 2026b, n.d.).23
References
Eurostat. (n.d.). Construction – Base year 2021 weights EU27 EA21 (spreadsheet). https://circabc.europa.eu/ui/group/c4b1ed1e-71ed-4622-b11e-d91429dd96f4/library/1de42ef2-c81b-415d-b211-656cdf39e9aa
Eurostat. (2026a, October 20). Production in construction up by 1.8% in the euro area and by 2.0% in the EU (Euro indicators). https://ec.europa.eu/eurostat/web/products-euro-indicators/w/4-20102026-ap
Eurostat. (2026b). Production in construction – monthly data (sts_copr_m) (data set). Downloaded October 20, 2026, from https://ec.europa.eu/eurostat/databrowser/view/sts_copr_m/default/table
Notes
-
EU rates, annual rates and the breakdown by construction sector are from the release (Eurostat, 2026a). ↑
-
Eurostat database (Eurostat, 2026b), data set sts_copr_m (production in construction, NACE Rev. 2 section F, index 2021=100, calendar and seasonally adjusted), euro area EA21 and member states, updated 20 October 2026, downloaded 20 October 2026: monthly data (CSV). Country weights (Eurostat, n.d.), sheet copr, Table 2 (total construction, countries' share of EA21, %): weights (CSV). Euro area aggregates are compiled from national indices with these weights; missing national observations are estimated by Eurostat. The workbook lists every number in the note next to the formula that produces it and a check against the text, so that readers who wish to examine the calculations can follow and audit them in a spreadsheet without losing time and without running any code. The code that draws the figure and repeats the same calculations is available on request. ↑
-
Calculations. Monthly rates from the index. Euro area: $$\left(\frac{104.8}{102.9}-1\right)\times 100 = 1.85$$ Germany and Italy: $$\left(\frac{99.9}{91.4}-1\right)\times 100 = 9.30, \qquad \left(\frac{135.2}{139.3}-1\right)\times 100 = -2.94$$ The contribution of country $i$ is $$c_i = \frac{w_i\,(I_{i,\text{Aug}} - I_{i,\text{Jul}})}{\sum_j w_j\, I_{j,\text{Jul}}}\times 100$$ where $w_i$ is the 2021 weight and the sums run over the twelve countries with an index in both months (95.1% of the euro area weight; Croatia and Luxembourg have no August figure, Ireland's figures are confidential, and Estonia, Greece, Cyprus, Latvia, Lithuania and Malta publish no monthly figures in the release). This gives Germany $2.51$, Italy $-0.58$ and the other eleven countries together $-0.47$ points; the twelve contributions sum to $2.05$, against $1.85$ for the published euro area index; the calculation covers 95.1% of the weight and does not reproduce the published index exactly, and no explanation of the gap is attempted here. The eleven countries excluding Germany: $$\frac{\sum_{i\neq \text{DE}} w_i I_{i,\text{Aug}}}{\sum_{i\neq \text{DE}} w_i I_{i,\text{Jul}}} - 1 = -0.64\%$$ Using the published euro area index instead, Germany's contribution in points: $$\frac{0.2867\times(99.9-91.4)}{102.9}\times 100 = 2.37$$ The rest of the euro area then changes by $$\frac{1.85-2.37}{1-0.2867\times 91.4/102.9} = -0.70\%$$ "Highest since November 2021": the German index was last at or above $99.9$ in November 2021 ($100.3$). ↑