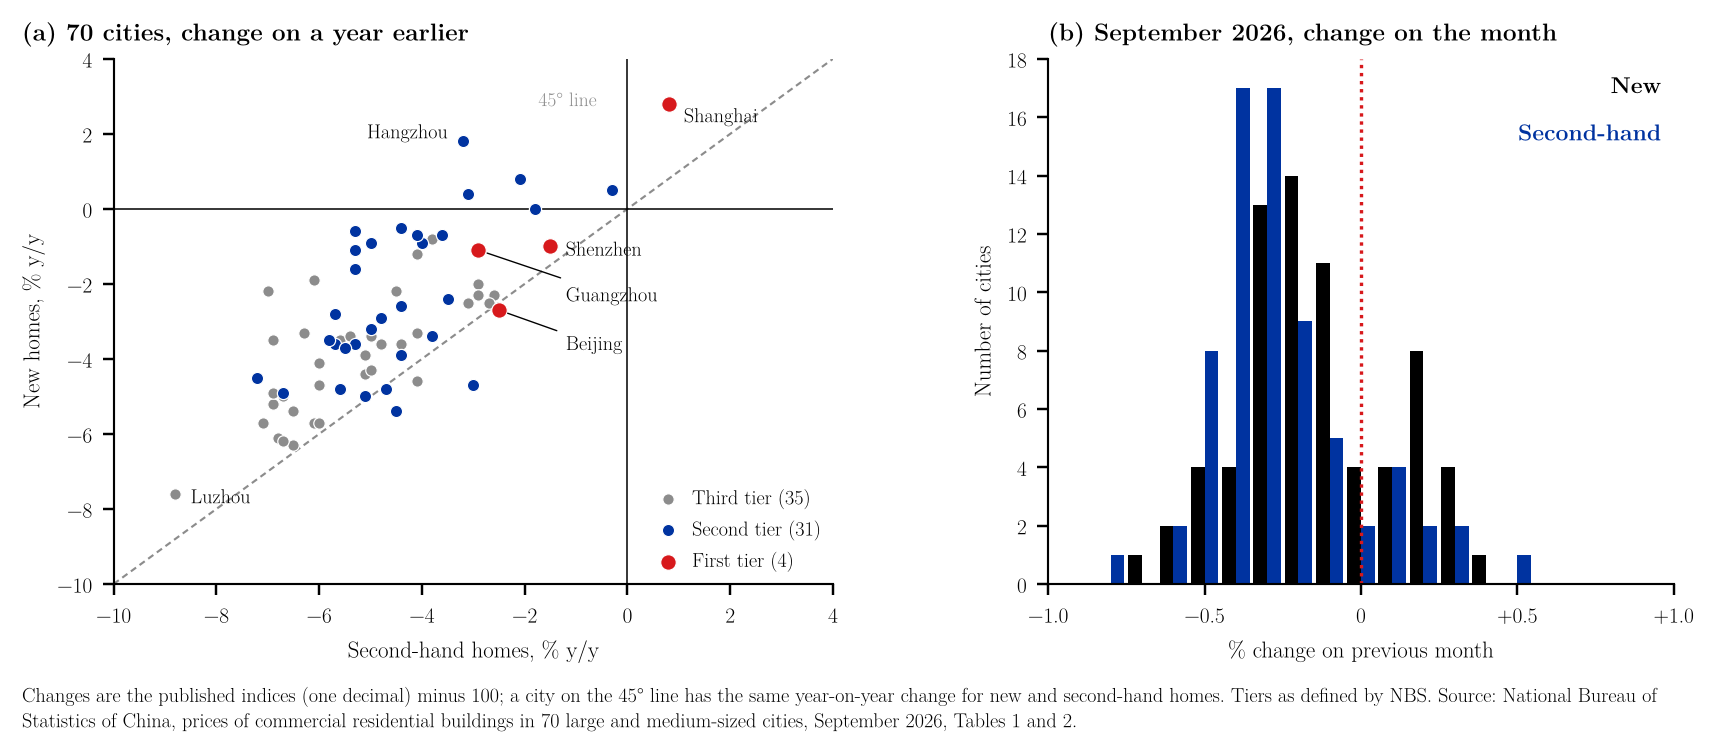
The National Bureau of Statistics of China (NBS) published its 70-city house price indices for September 2026 on 19 October (NBS, 2026a).1 In the four first-tier cities, prices of new homes rose 0.1% on the month, the same as in August, and second-hand prices rose 0.2%. New-home prices were flat in the 31 second-tier cities, after −0.1% in August, and fell 0.2% in the 35 third-tier cities; second-hand prices fell 0.2% and 0.3% (NBS, 2026a, 2026b). Of the 70 cities, 17 recorded a monthly rise in new-home prices, two more than in August, and 9 a rise in second-hand prices, six more (NBS, 2026b). That still leaves most of the country on the downside: 49 cities had lower new-home prices than in August and 59 lower second-hand prices, and the median monthly change was −0.2% for new homes and −0.3% for second-hand homes (NBS, 2026a; Figure 1b; note 4). On the year, NBS reports that the declines narrowed in all three tiers: new homes −0.5% in first-tier, −2.4% in second-tier and −3.9% in third-tier cities, second-hand homes −1.5%, −4.5% and −5.4% (NBS, 2026a, 2026b). Across cities, new-home prices were higher than a year earlier in five (Shanghai 2.8%, Hangzhou 1.8%, Dalian 0.8%, Shenyang 0.5%, Hefei 0.4%) and unchanged in Ningbo; second-hand prices were higher only in Shanghai (0.8%) (NBS, 2026a). The weakest readings for both were in Luzhou: −7.6% for new and −8.8% for second-hand homes (NBS, 2026a).
Figure 1a puts the two year-on-year changes side by side for each city (NBS, 2026a; notes 3 and 4). Two regularities appear in the data. First, the two markets move together across cities: the correlation is 0.73, and a least-squares line through the 70 points has a slope of 0.88 (standard error 0.10, R² = 0.54), so a city where second-hand prices are one point lower on the year has, on average, new-home prices about 0.9 point lower. Second, almost every city lies above the 45° line: in 65 of 70 the new-home index has fallen less than the second-hand index, by 1.72 points on average, and a Wilcoxon signed-rank test rejects a zero median gap at any conventional level. The five exceptions are Beijing, Anqing, Fuzhou, Zhengzhou and Xining. I read these numbers as a description of one month's cross-section, nothing more: the 70 cities are a fixed list chosen by NBS, so the standard errors are descriptive, and a gap between the two indices does not by itself tell us why it exists; new and second-hand homes can differ in location, age and quality. The volume data in the same morning's national accounts release are also split: in January–September the floor area of new commercial housing sold fell 13.2% on the year, while the area of second-hand homes traded under online contracts rose 10.7% (NBS, 2026c).2 The city data are in note 3 and the arithmetic in note 4.34
References
National Bureau of Statistics of China. (2026a, October 19). 2026年9月份70个大中城市商品住宅销售价格变动情况 (in Chinese; English title: Changes in sales prices of commercial residential buildings in 70 large and medium-sized cities, September 2026). https://www.stats.gov.cn/sj/zxfb/202610/t20261019_1965609.html
National Bureau of Statistics of China. (2026b, October 19). 国家统计局城市司高级统计师杨彩芳解读2026年9月份商品住宅销售价格变动情况统计数据 (in Chinese; English title: Interpretation of the September 2026 statistics on changes in sales prices of commercial residential buildings by Yang Caifang, senior statistician of the NBS Department of Urban Surveys). https://www.stats.gov.cn/sj/sjjd/202610/t20261019_1965610.html
National Bureau of Statistics of China. (2026c, October 19). 前三季度经济运行总体平稳 高质量发展取得新成效 (in Chinese; English title: The national economy was generally stable in the first three quarters, with new progress in high-quality development). https://www.stats.gov.cn/sj/zxfb/202610/t20261019_1965618.html
Notes
-
The city and tier figures are from Tables 1 and 2 of the Chinese release (NBS, 2026a). The tier averages, the number of cities with monthly rises and the tier definitions used here are from the interpretation by Yang Caifang, senior statistician of the NBS Department of Urban Surveys (NBS, 2026b). The English titles of the Chinese releases in the reference list were translated from Chinese with DeepL; the Chinese titles are given as published. ↑
-
Section 5 of the national accounts release of the same day (NBS, 2026c). ↑
-
City indices for new and second-hand homes (previous month = 100, same month a year earlier = 100, January–September average = 100) with the NBS tier of each city: data (CSV). Percentage changes are the published one-decimal indices minus 100. The workbook lists every number in the note next to the formula that produces it and a check against the text, so that readers who wish to examine the calculations can follow and audit them in a spreadsheet without losing time and without running any code. The code that draws the figure and repeats the same calculations is available on request. ↑
-
Calculations. Write $n_i$ and $s_i$ for the year-on-year change of new and second-hand prices in city $i$, $i = 1, \dots, 70$. Counts: $n_i > 0$ in 5 cities, $n_i = 0$ in 1, $s_i > 0$ in 1; for the monthly changes, 17 rises, 4 unchanged and 49 falls for new homes, and 9, 2 and 59 for second-hand homes, matching the NBS counts of 17 and 9. Means and medians: $\bar n = -3.04$, $\operatorname{med}(n) = -3.4$; $\bar s = -4.75$, $\operatorname{med}(s) = -5.0$. Least squares across cities, with conventional standard errors in parentheses: $$\hat n_i = \underset{(0.50)}{1.14} + \underset{(0.10)}{0.88}\, s_i, \qquad R^2 = 0.54$$ $R^2$ equals the squared correlation, $0.734^2 = 0.54$. Gap $d_i = n_i - s_i$: $d_i > 0$ in 65 cities, $\bar d = 1.72$, standard deviation $1.42$. The $t$ statistic of the mean gap: $$t = \frac{1.72}{1.42/\sqrt{70}} = 10.1$$ The Wilcoxon signed-rank test gives $p < 10^{-10}$. Tier averages: simple means of the city changes reproduce the NBS first-tier figures (new $+0.125$ on the month, $-0.50$ on the year; second-hand $+0.225$ and $-1.525$) and all second- and third-tier figures except two second-tier monthly changes, where the simple means are $-0.06$ for new and $-0.28$ for second-hand homes against published $0.0$ and $-0.2$. NBS does not publish the weights it uses to aggregate cities, so the published tier figures are used in the text. ↑