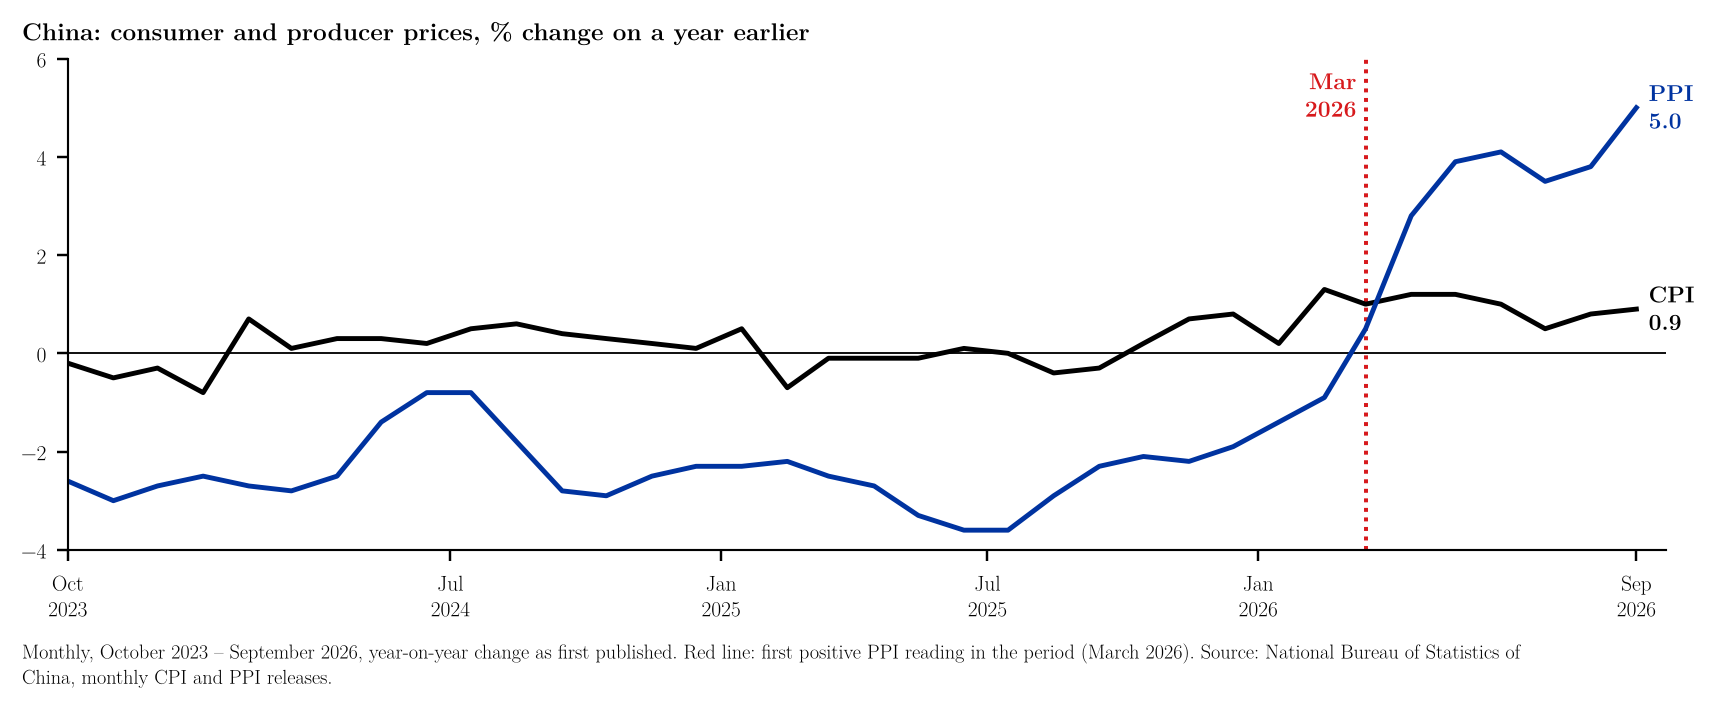
According to the National Bureau of Statistics of China (NBS), which published its September figures on 14 October 2026, consumer prices rose 0.9% on a year earlier, after 0.8% in August, and 0.2% on the previous month (NBS, 2026a); producer prices rose 5.0% on a year earlier and 1.2% on the month, the highest year-on-year reading in the three years shown in Figure 1 (NBS, 2026b; note 3).1 Food prices were 1.7% lower than a year earlier, with pork down 10.0%, while non-food prices rose 1.5%; the CPI excluding food and energy rose 1.0% (NBS, 2026a). On the producer side the increase was concentrated upstream: prices of means of production rose 6.5% and mining prices 25.4%, while prices of consumer goods fell 0.1%, and industrial purchase prices rose 6.9% (NBS, 2026b). The PPI turned positive in March 2026 (0.5%) after negative readings in every month from October 2023 to February 2026 (Figure 1; NBS monthly releases, note 2); over January–September 2026 it averaged 2.3% above a year earlier, against 0.9% for the CPI (NBS, 2026a, 2026b).2 Both releases note that the indexes have been compiled on a 2025 base since January 2026, a change that NBS estimates moved the monthly year-on-year rates by about 0.06 percentage points for the CPI and 0.08 for the PPI on average (NBS, 2026a, 2026b). The releases do not discuss the reasons for these changes, and this note only summarises the published figures.3
References
National Bureau of Statistics of China. (2026a, October 14). 2026年9月份居民消费价格同比上涨0.9% (in Chinese; English title: Consumer prices in September 2026 rose 0.9% year on year). https://www.stats.gov.cn/sj/zxfb/202610/t20261014_1965477.html
National Bureau of Statistics of China. (2026b, October 14). 2026年9月份工业生产者出厂价格同比上涨5.0% 环比上涨1.2% (in Chinese; English title: Producer prices for industrial products in September 2026 rose 5.0% year on year and 1.2% month on month). https://www.stats.gov.cn/sj/zxfb/202610/t20261014_1965476.html
Notes
-
The September figures are taken from the text and main data tables of the Chinese releases (NBS, 2026a, 2026b); the English versions had not been posted when this note was written. The English titles of the Chinese releases in the reference list were translated from Chinese with DeepL; the Chinese titles are given as published. ↑
-
Monthly year-on-year rates as first published in each NBS release, October 2023 – September 2026: data (CSV, with the release link for every month). The workbook lists every number in the note next to the formula that produces it and a check against the text, so that readers who wish to examine the calculations can follow and audit them in a spreadsheet without losing time and without running any code. The code that draws the figure and repeats the same calculations is available on request. ↑
-
Calculations. "The highest year-on-year reading in the three years shown" means $\pi^{PPI}_t \le 5.0$ for every month $t$ from October 2023 to September 2026, with equality only in September 2026. "Negative in every month from October 2023 to February 2026" means $\pi^{PPI}_t < 0$ for each of those 29 months, and March 2026 (0.5) is the first month with $\pi^{PPI}_t > 0$. The January–September averages (2.3% for the PPI, 0.9% for the CPI) are the figures NBS states in the releases ("1—9月平均"); they are not computed here. For comparison, the simple mean of the rounded monthly rates in the CSV: $$\bar\pi = \frac{1}{9}\sum_{t=\text{Jan}}^{\text{Sep}} \pi_t$$ PPI: $$\frac{-1.4 - 0.9 + 0.5 + 2.8 + 3.9 + 4.1 + 3.5 + 3.8 + 5.0}{9} = 2.37$$ CPI: $$\frac{8.1}{9} = 0.90$$ The mean of the rounded monthly rates therefore gives 2.4 for the PPI, not the 2.3 that NBS publishes; NBS's January–September figure is a comparison of the whole period with the same period a year earlier, which need not equal the mean of the nine rounded monthly rates. ↑